
Admin Console Surface
This page is the technical inventory for the Admin Console surface. Start with Use the Admin Console for the operator workflow; use this page when you need screen coverage and endpoint mapping.
The Admin Console is the browser control plane for a running awaken-server:
configure providers and models, edit prompts and tool descriptions, assign MCP
tools, tune reminders and deferred-tool policy, preview a draft, then publish
the next registry snapshot. Starting the server + console is covered in
Use the Admin Console.
Screenshots
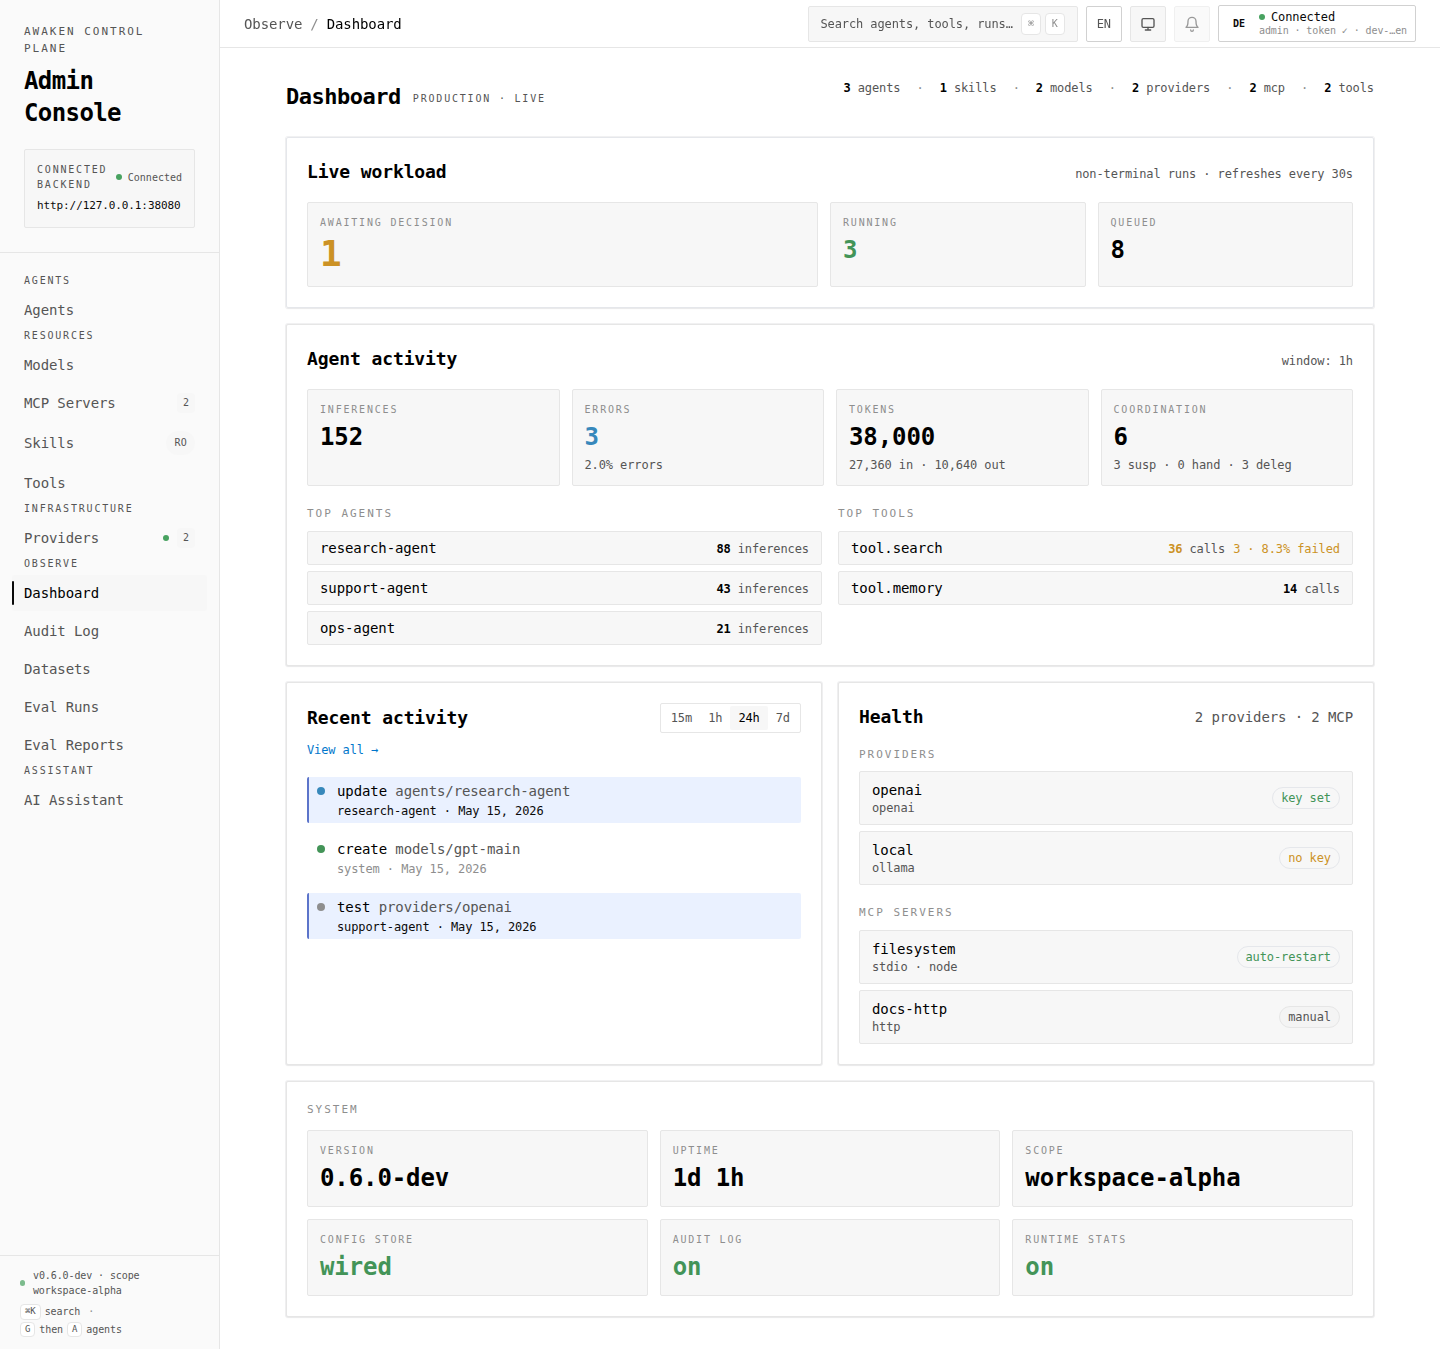
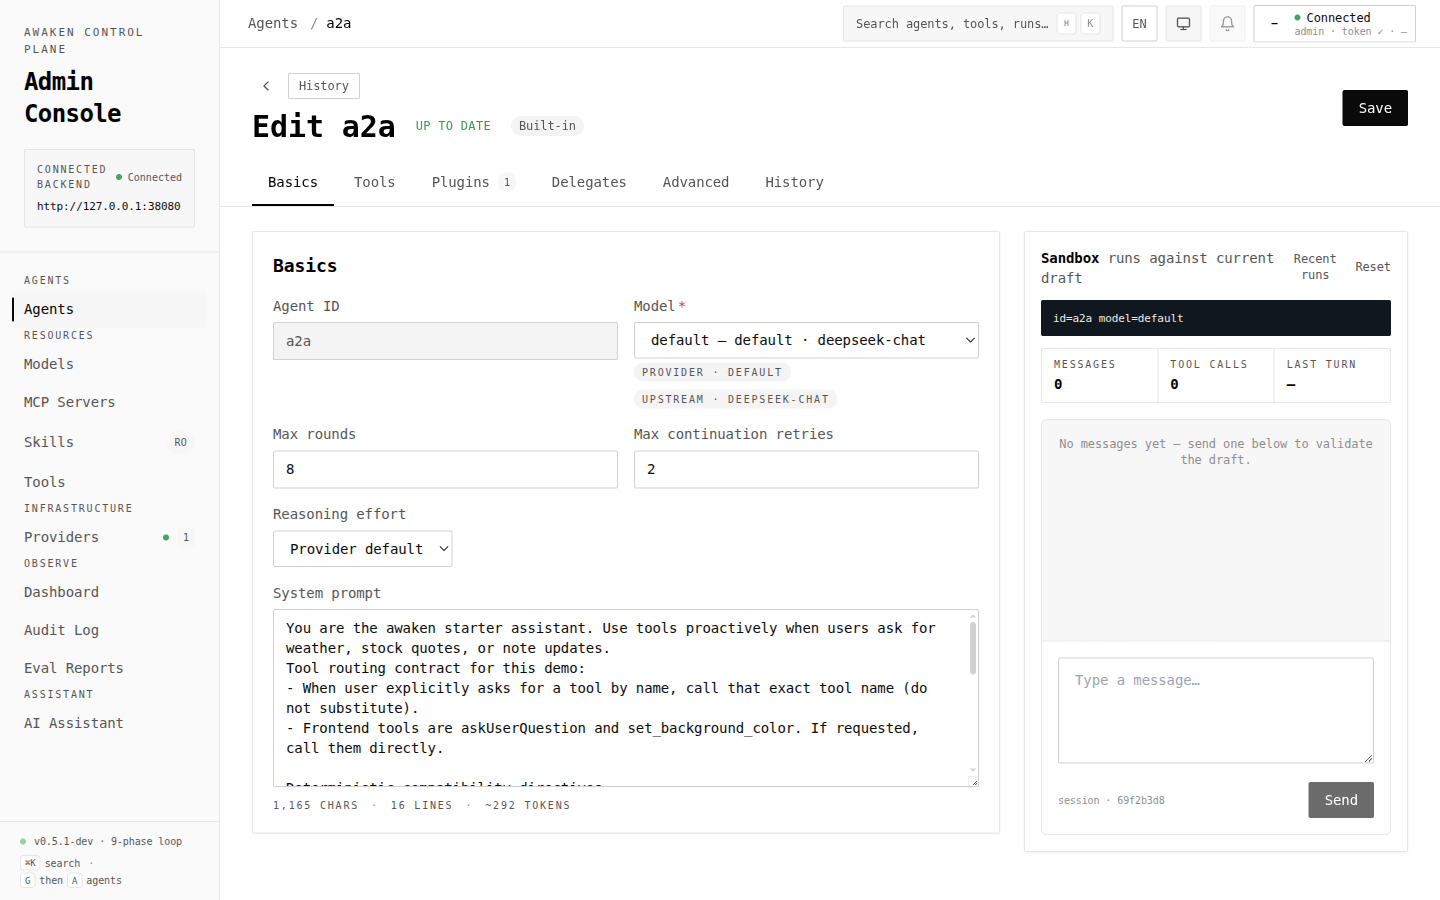
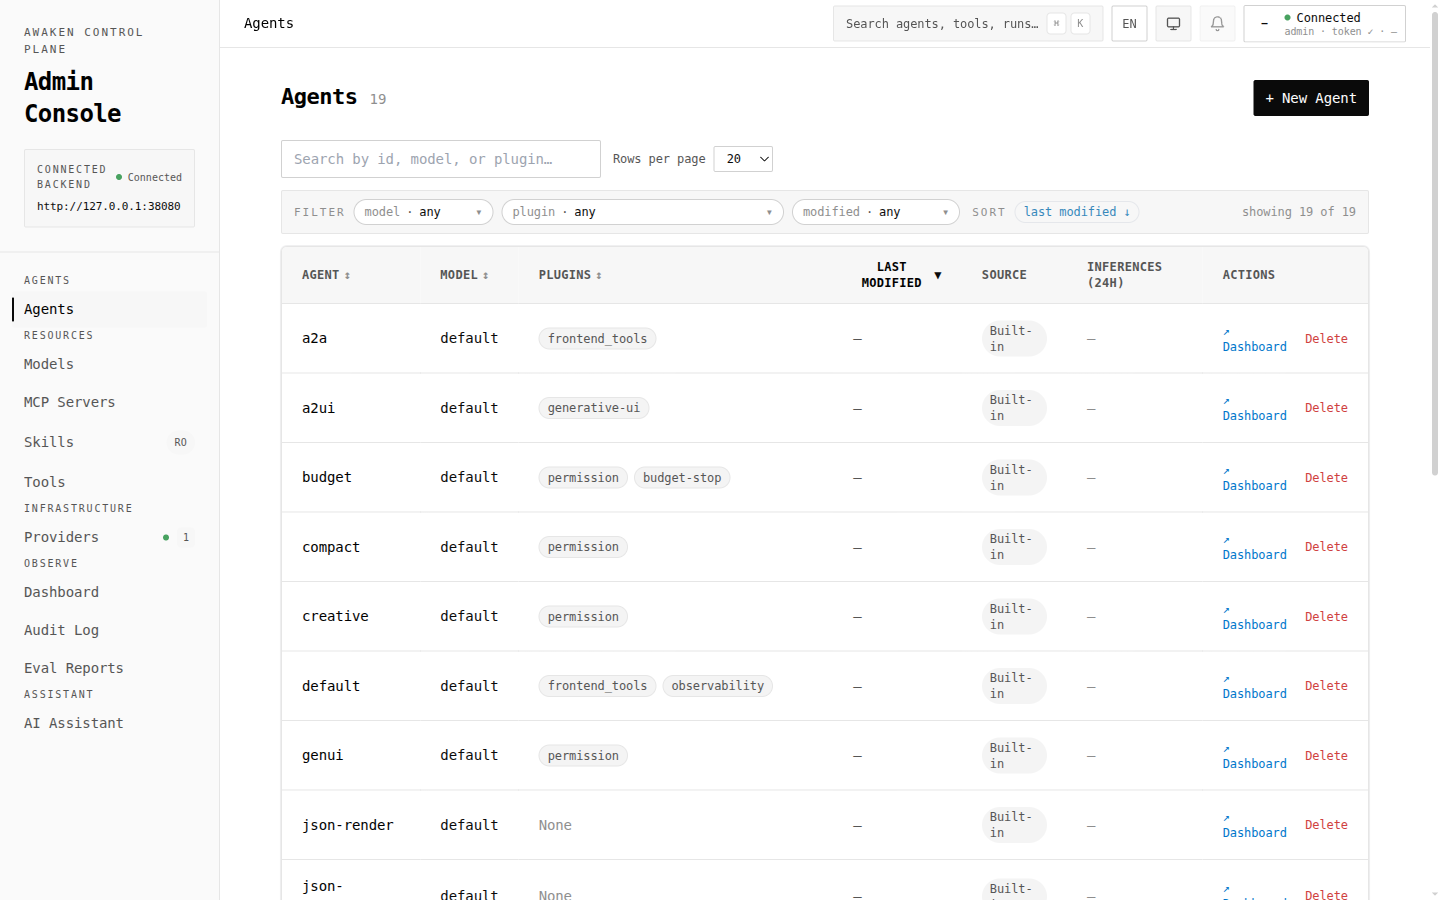
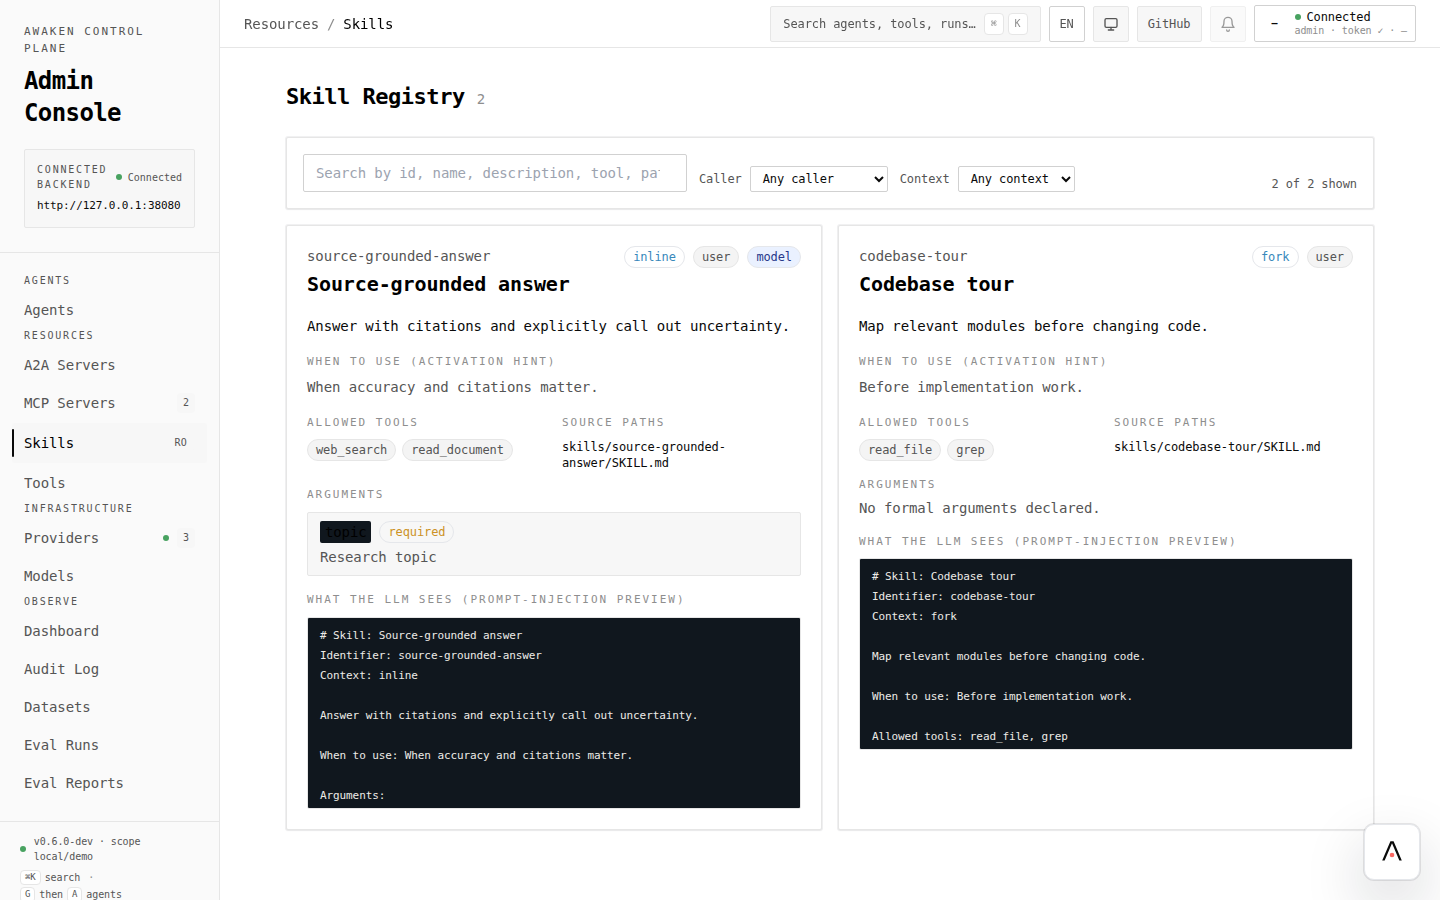
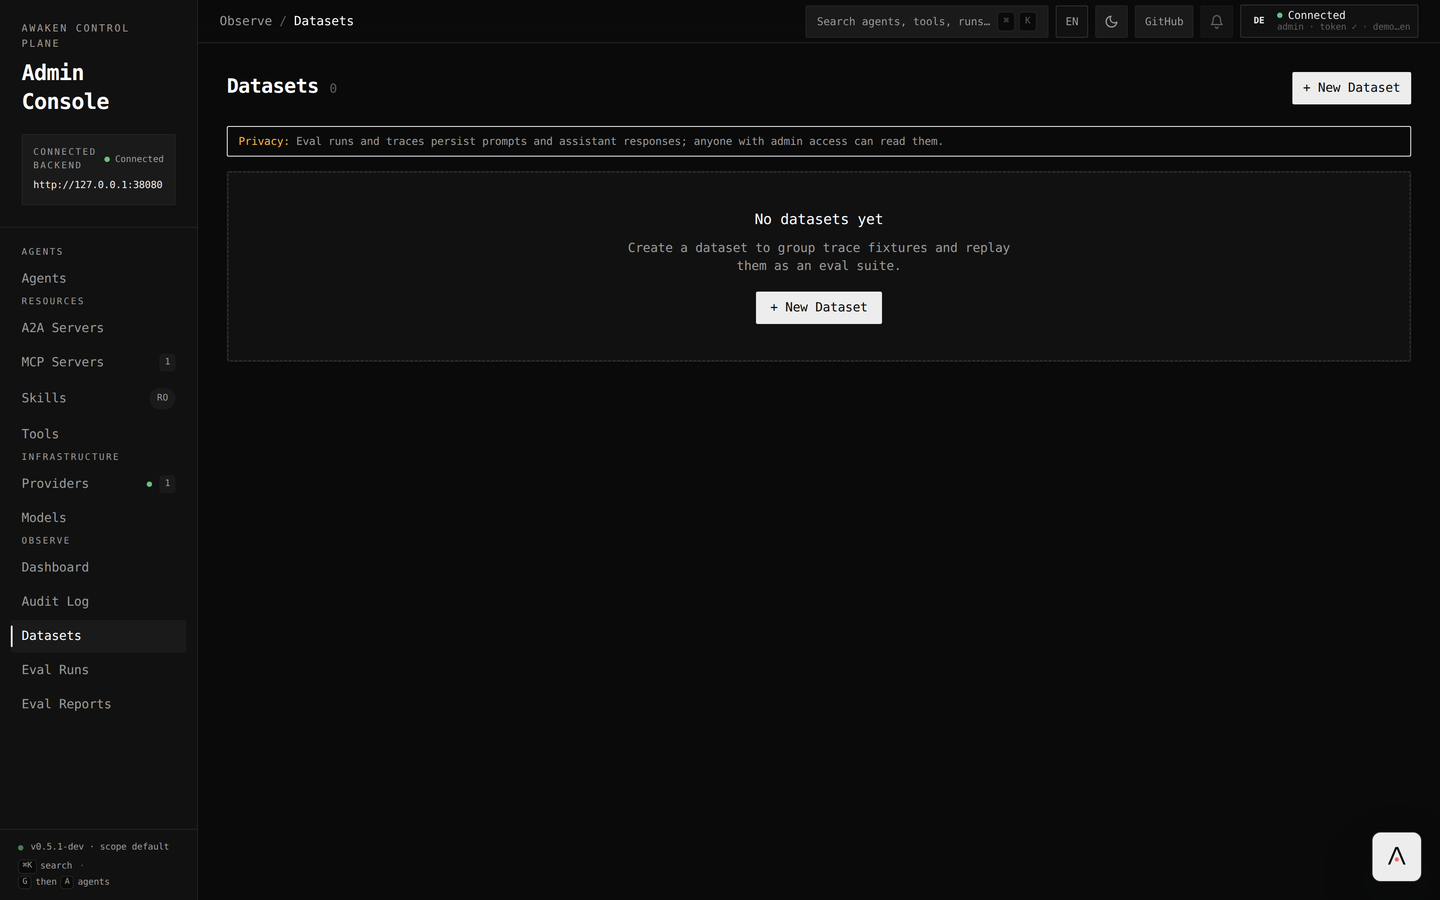
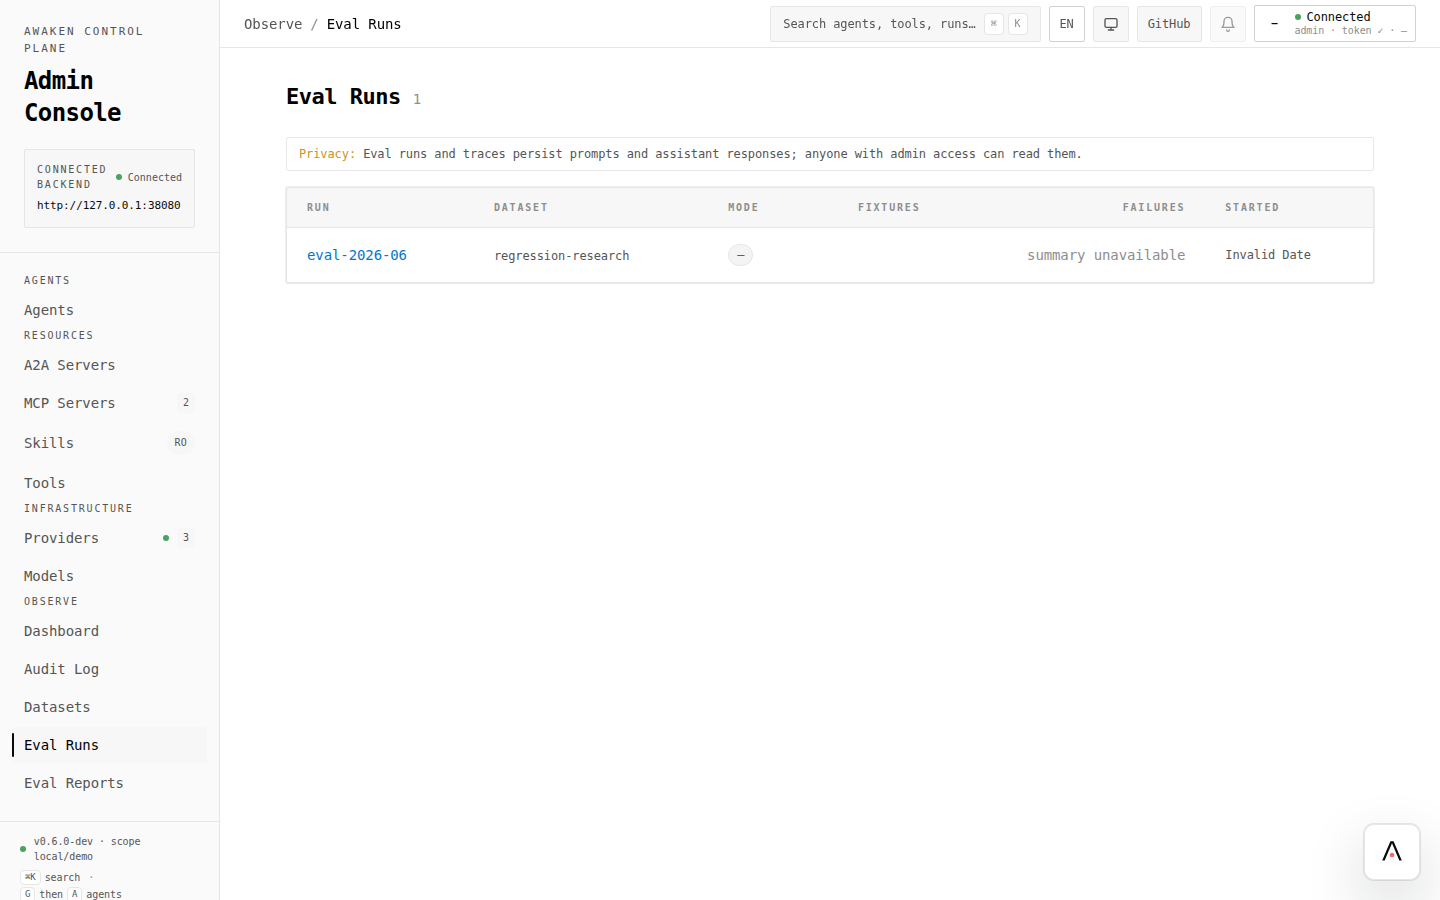
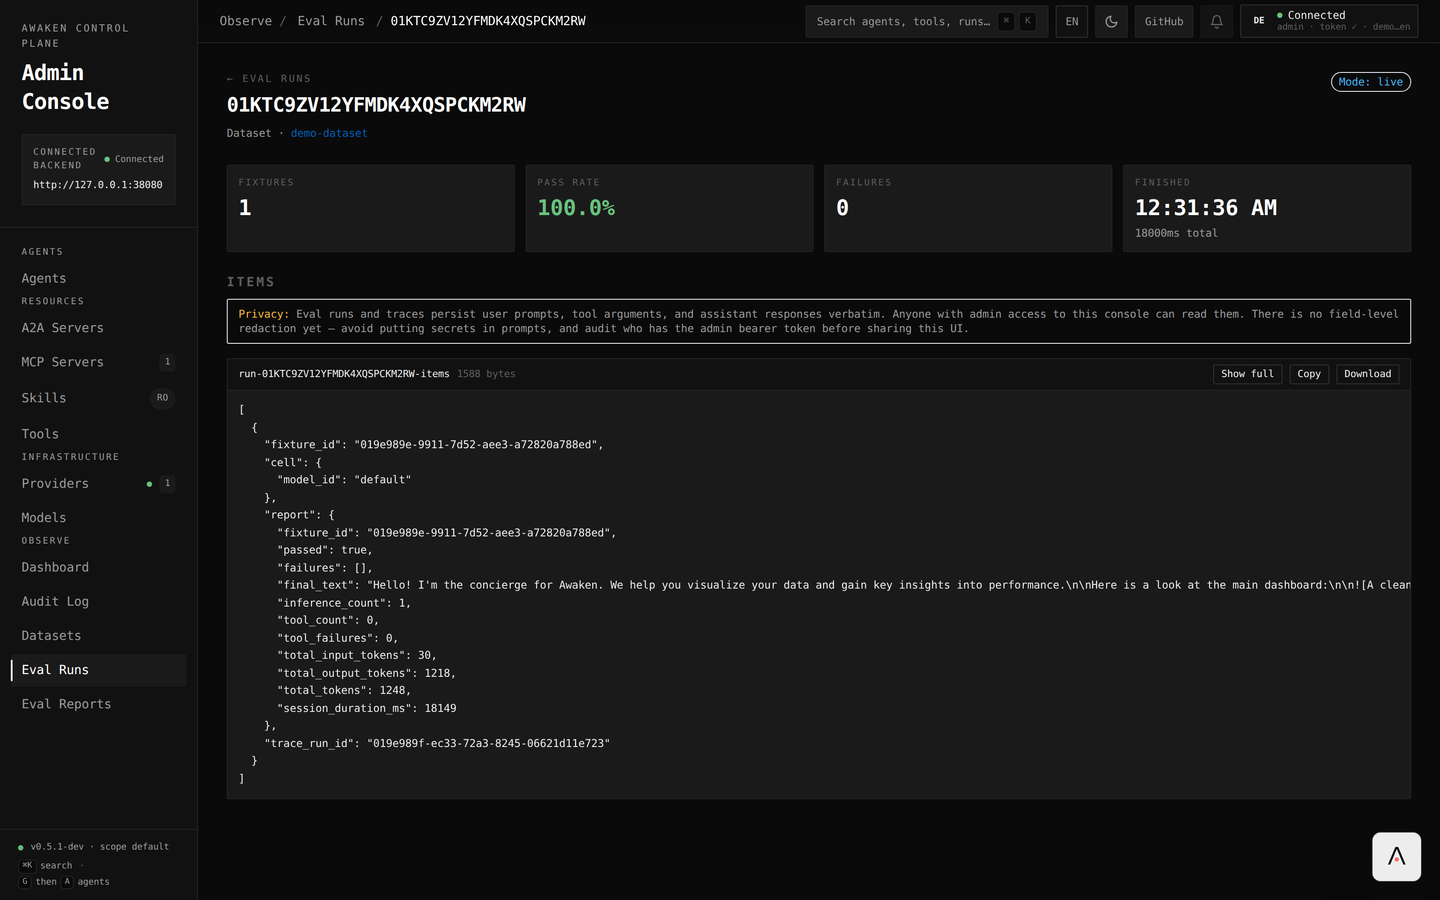
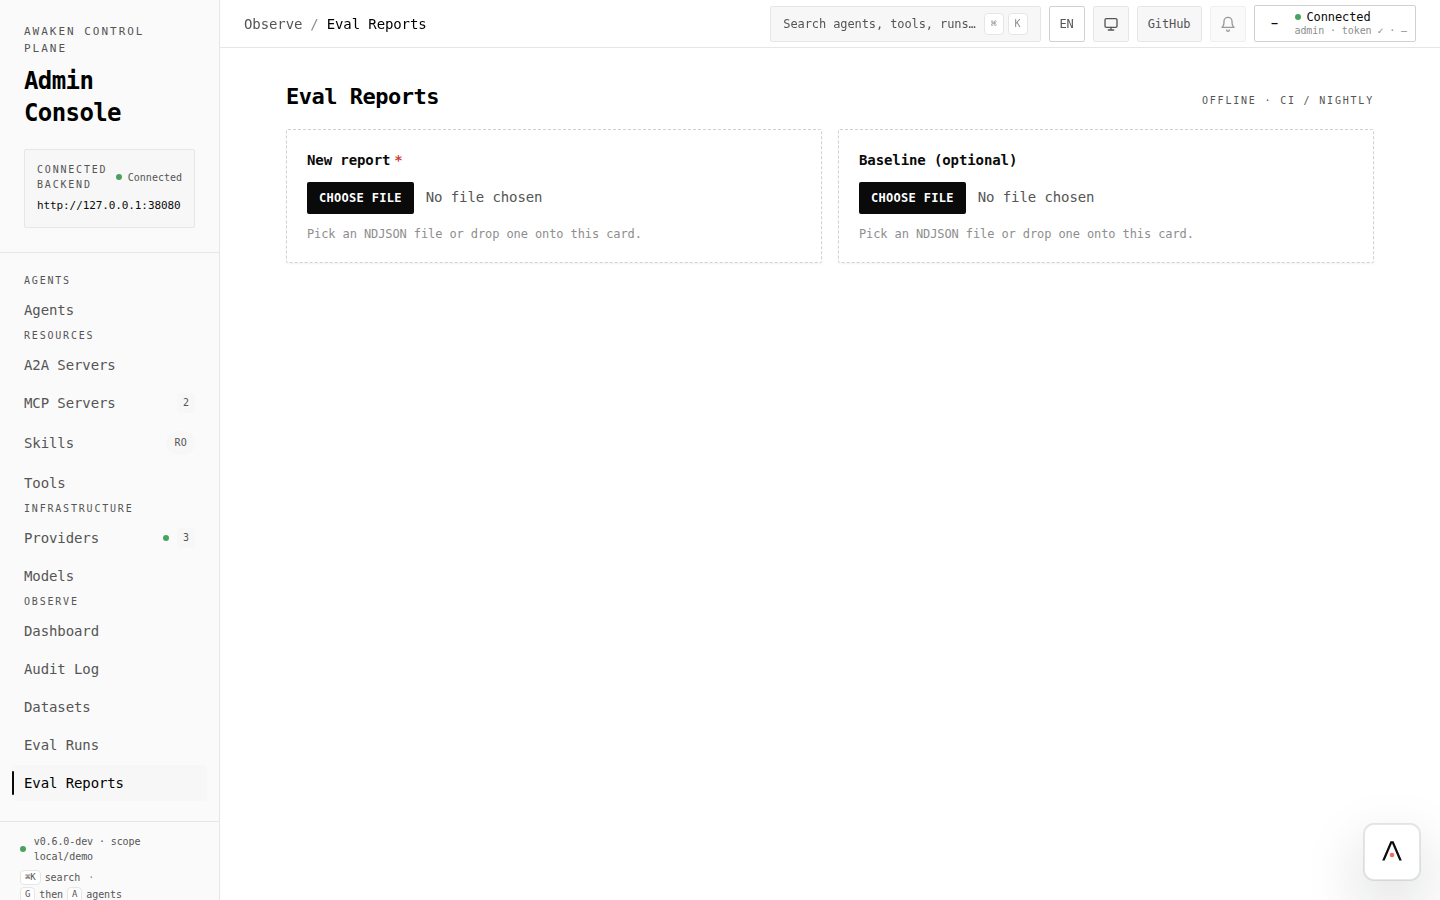
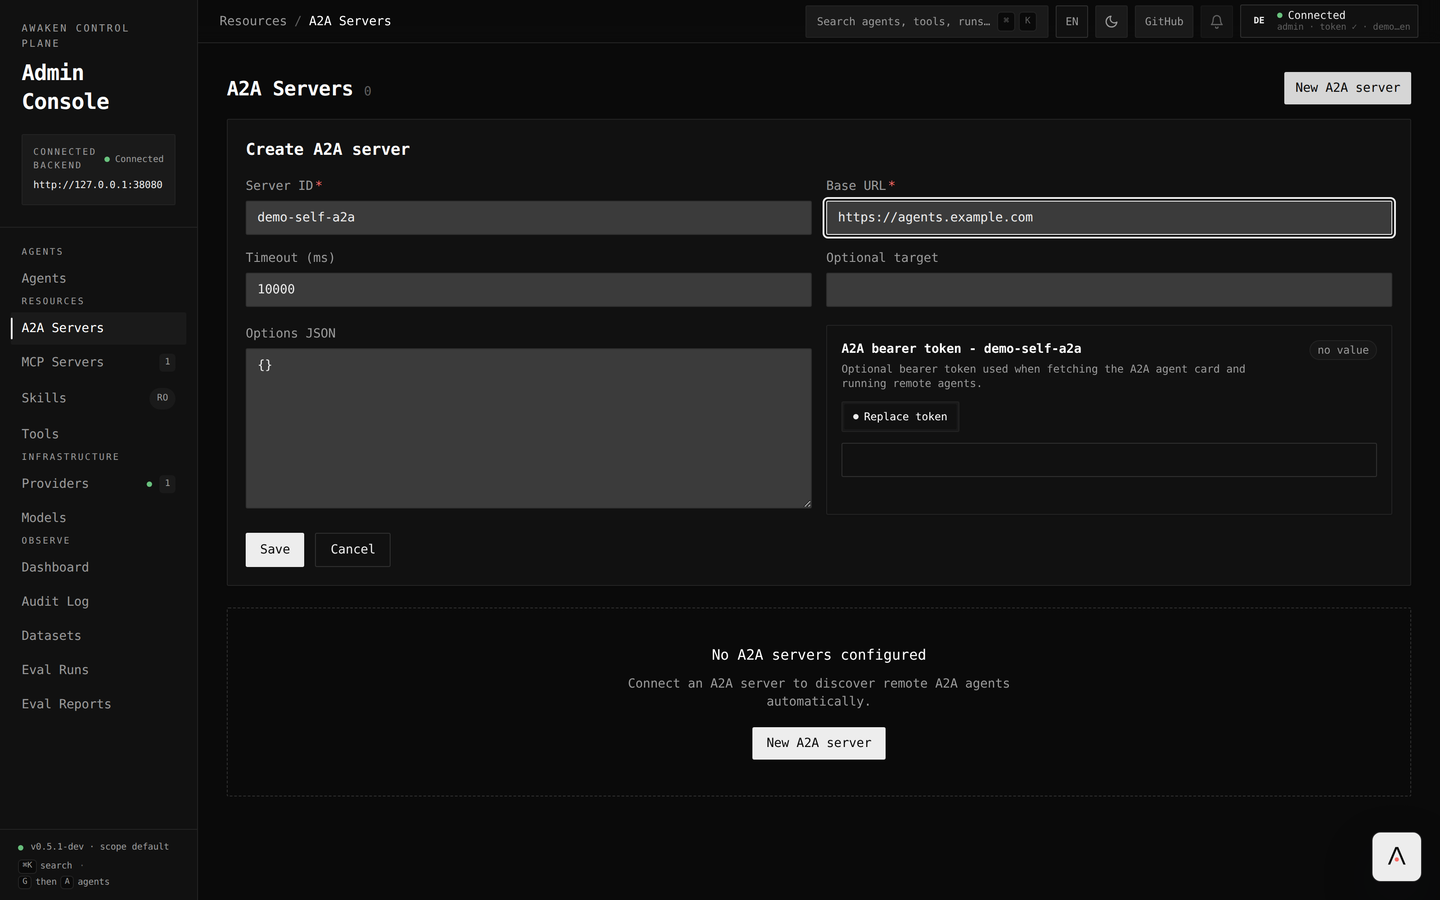
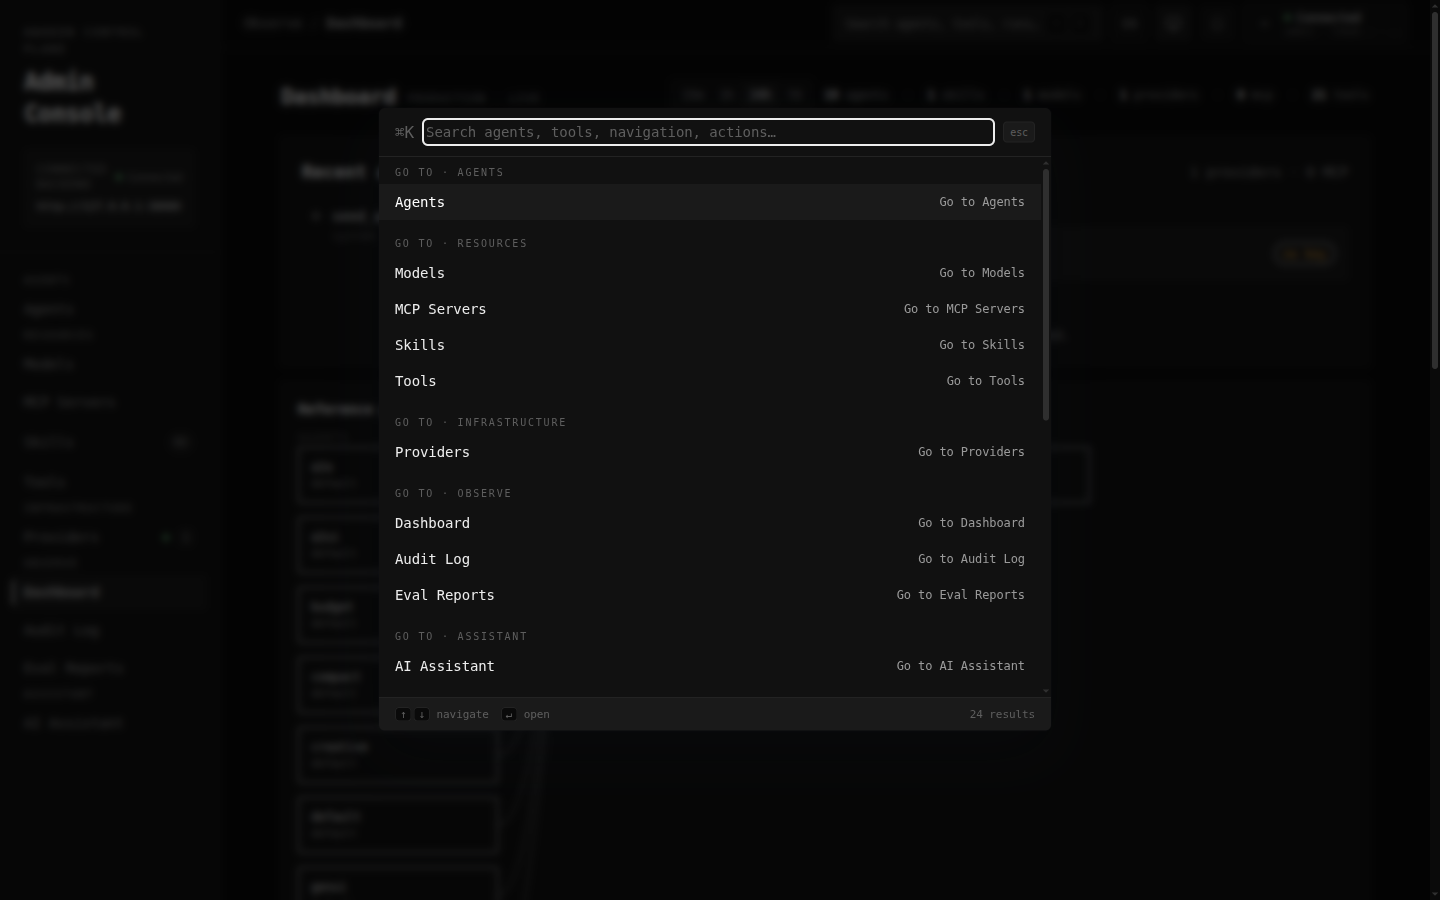
Section titled “Screenshots”The screenshots show representative console states. A running console reads values from your backend APIs; if a subsystem is not wired, the corresponding surface shows a disabled or unavailable notice.
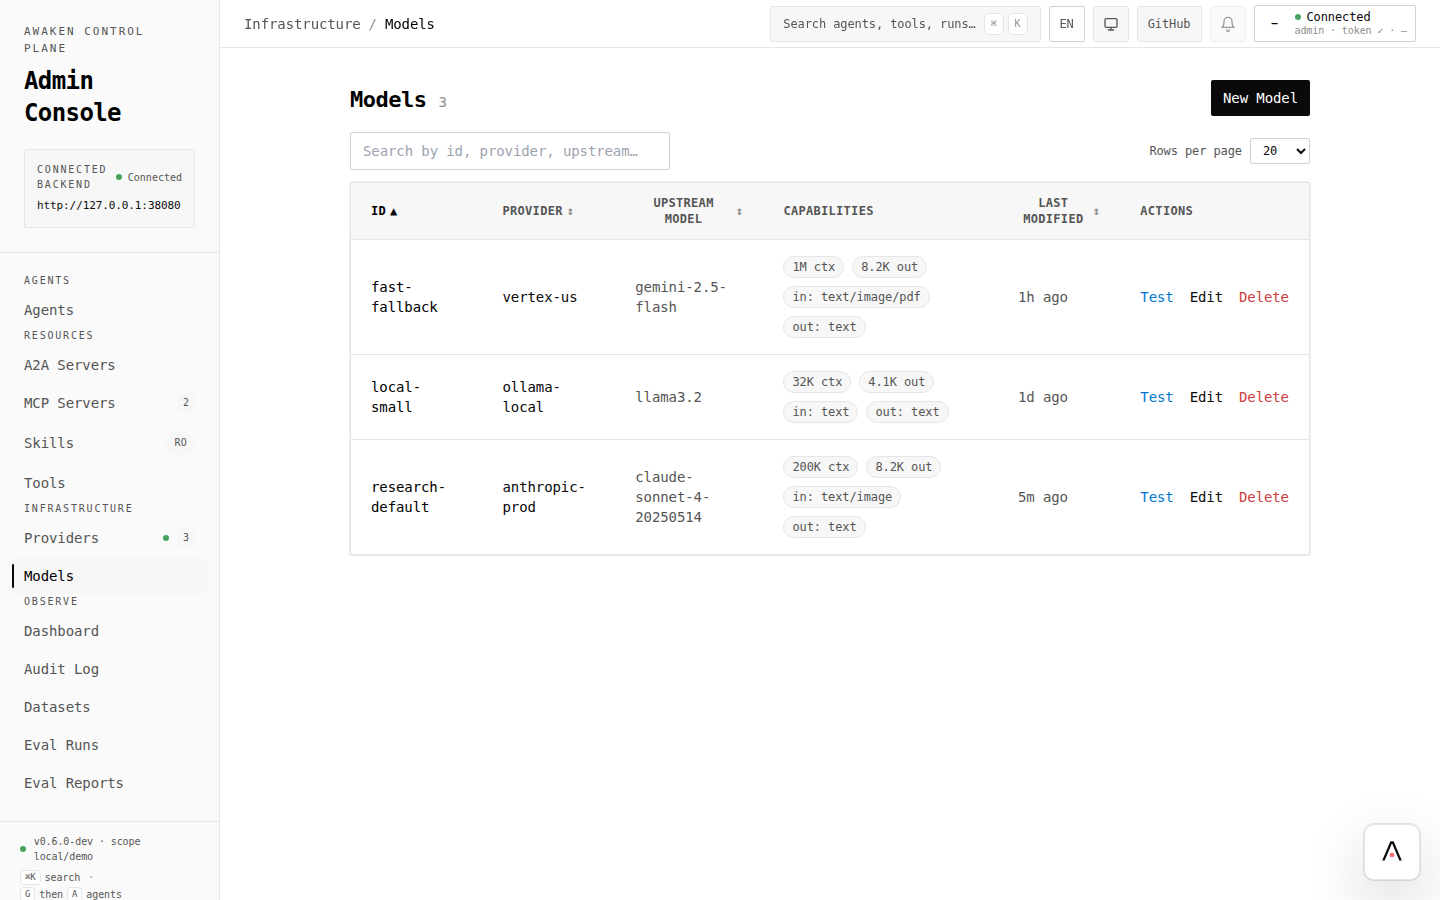
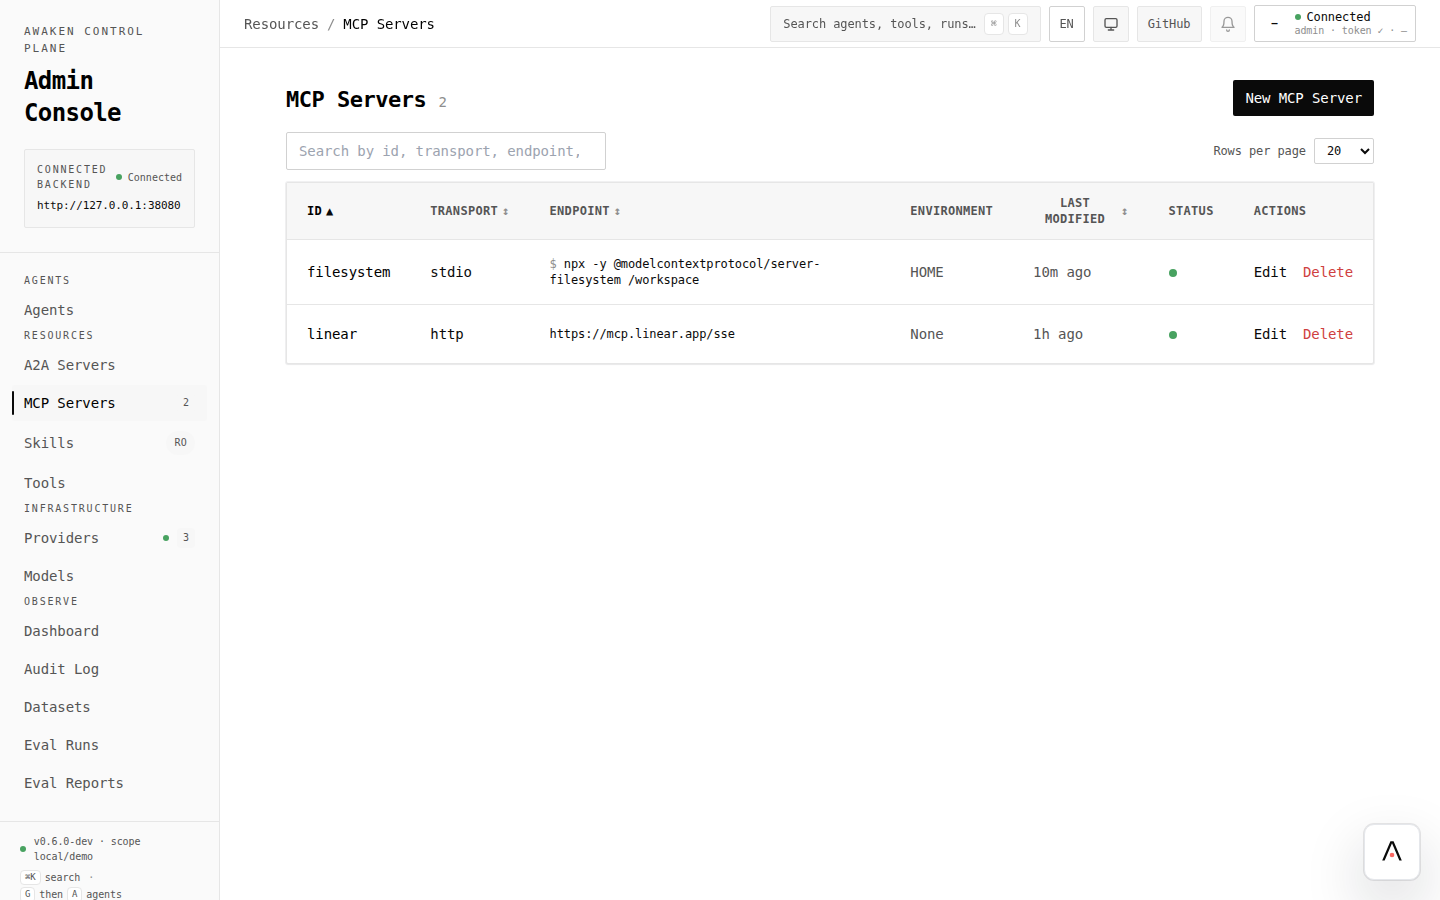
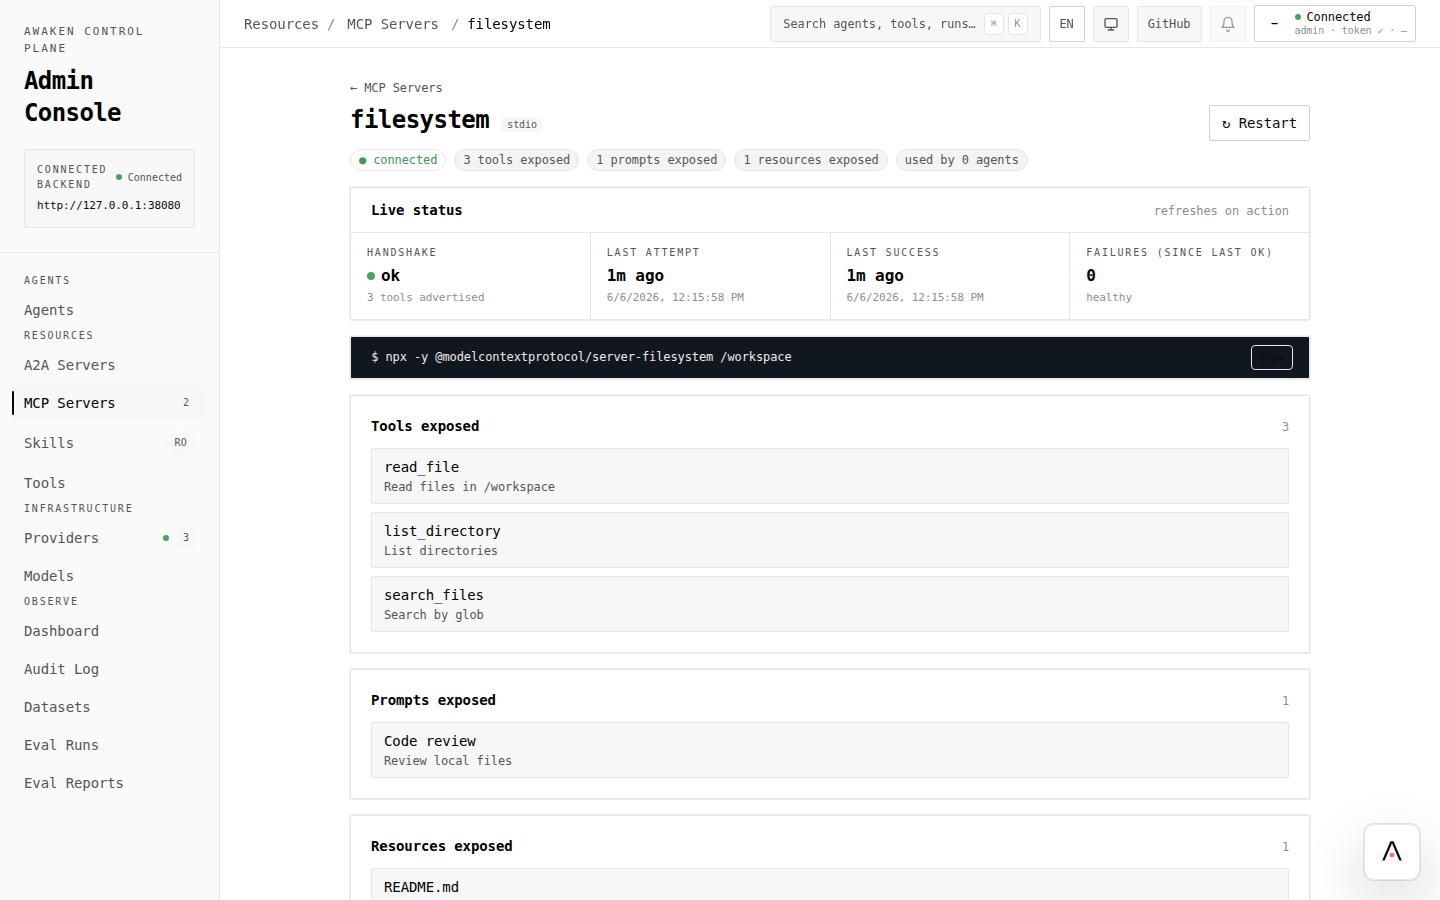
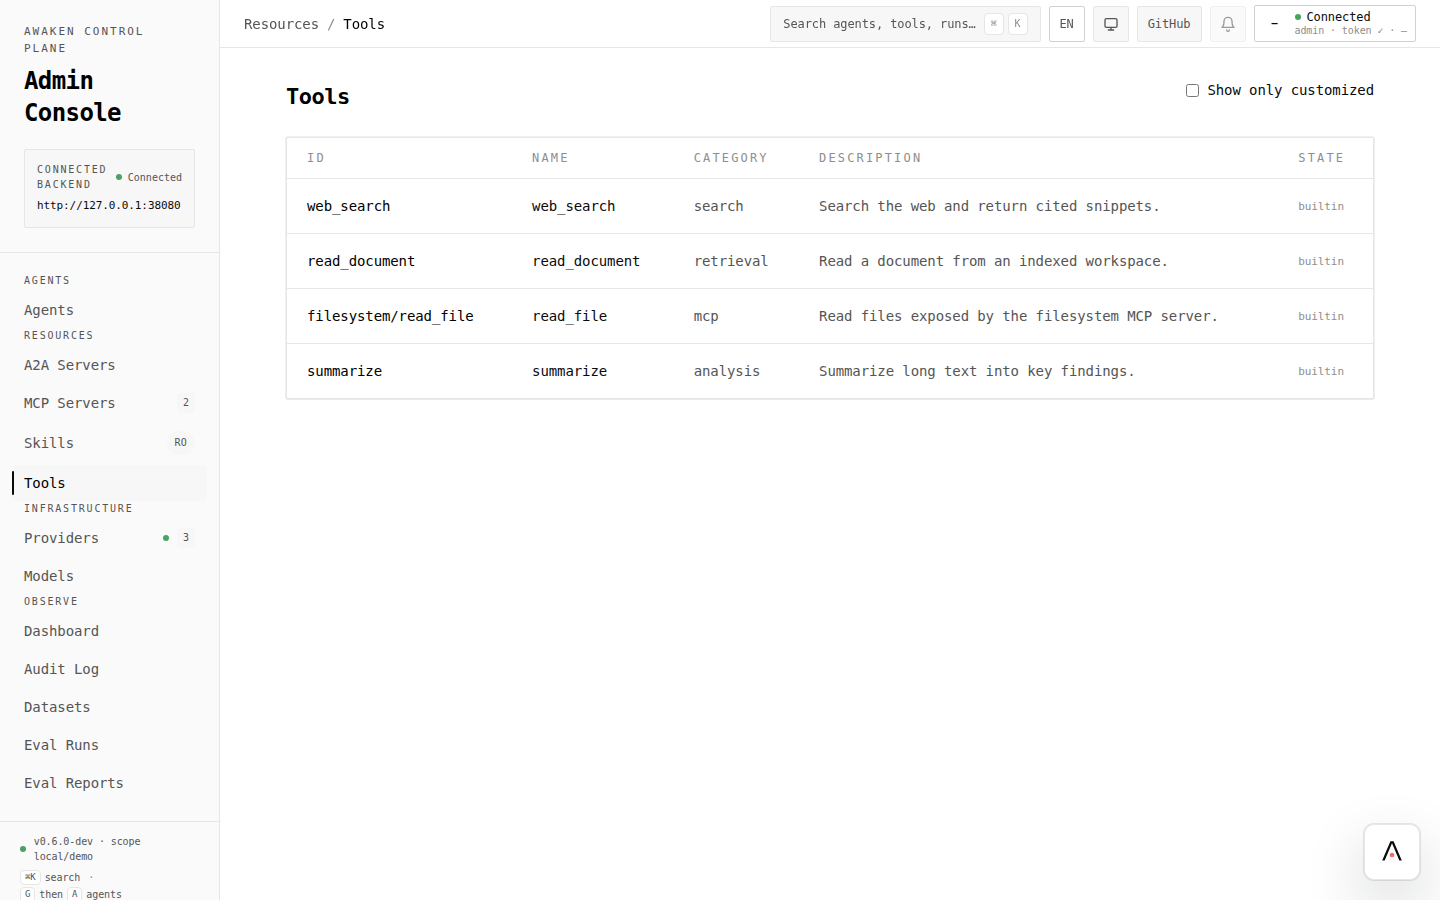
Infrastructure and resources
Section titled “Infrastructure and resources”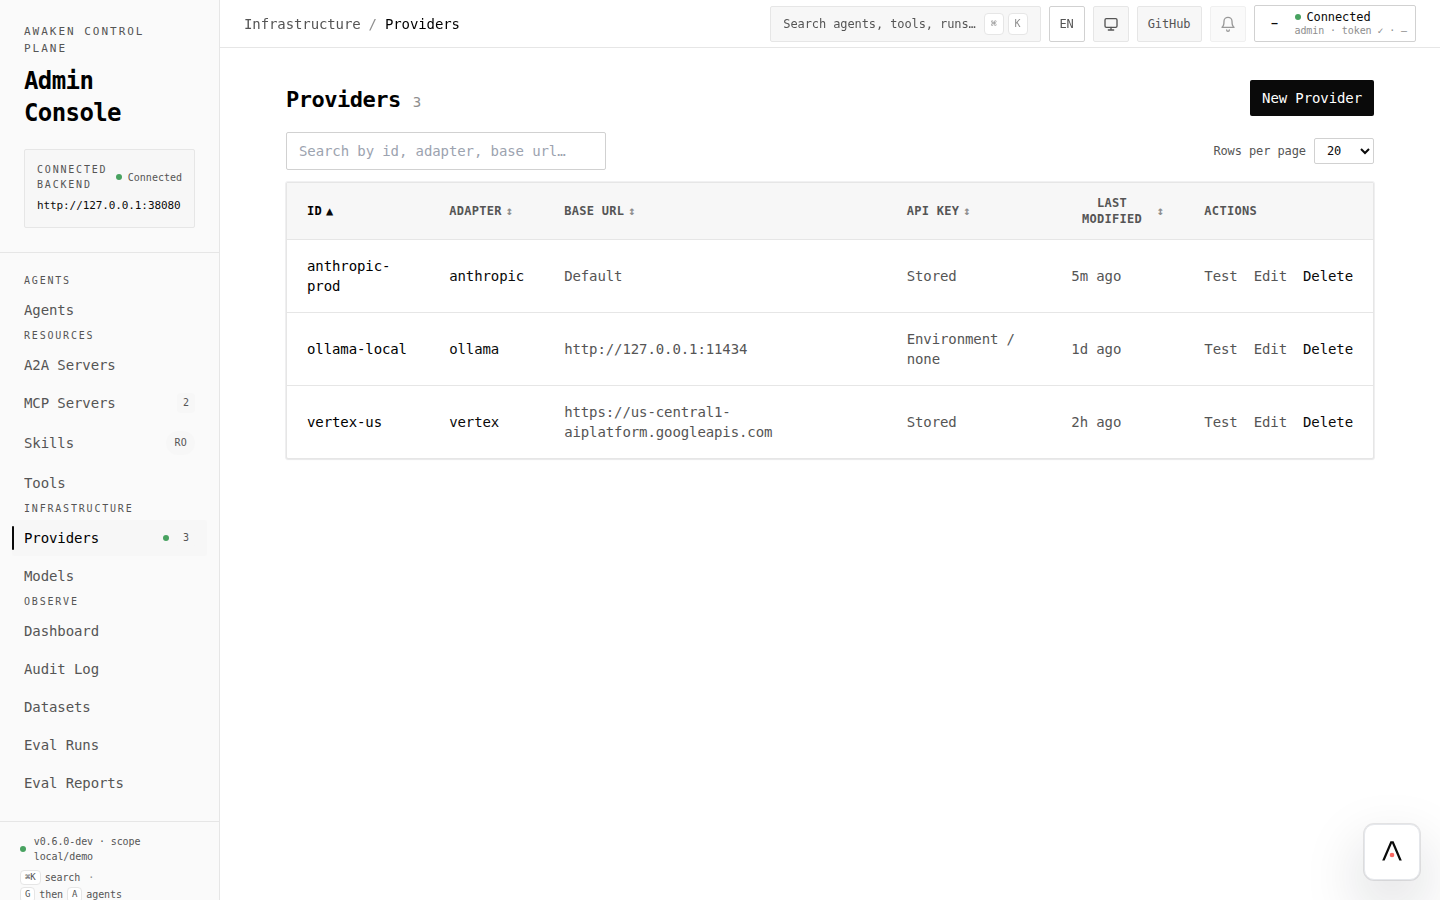
Observe and evaluate
Section titled “Observe and evaluate”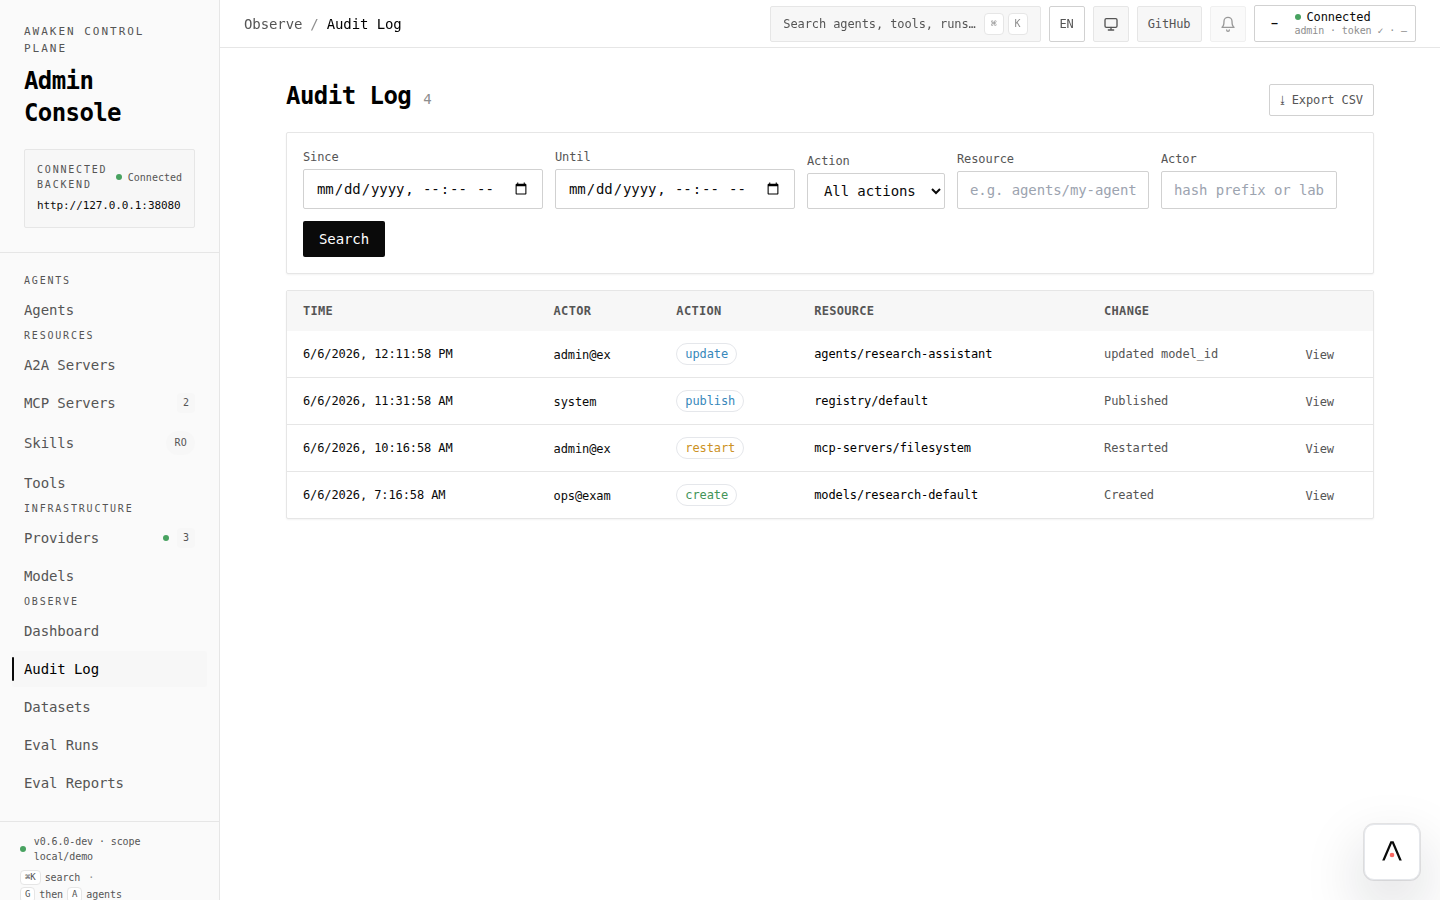
Assistant and shortcuts
Section titled “Assistant and shortcuts”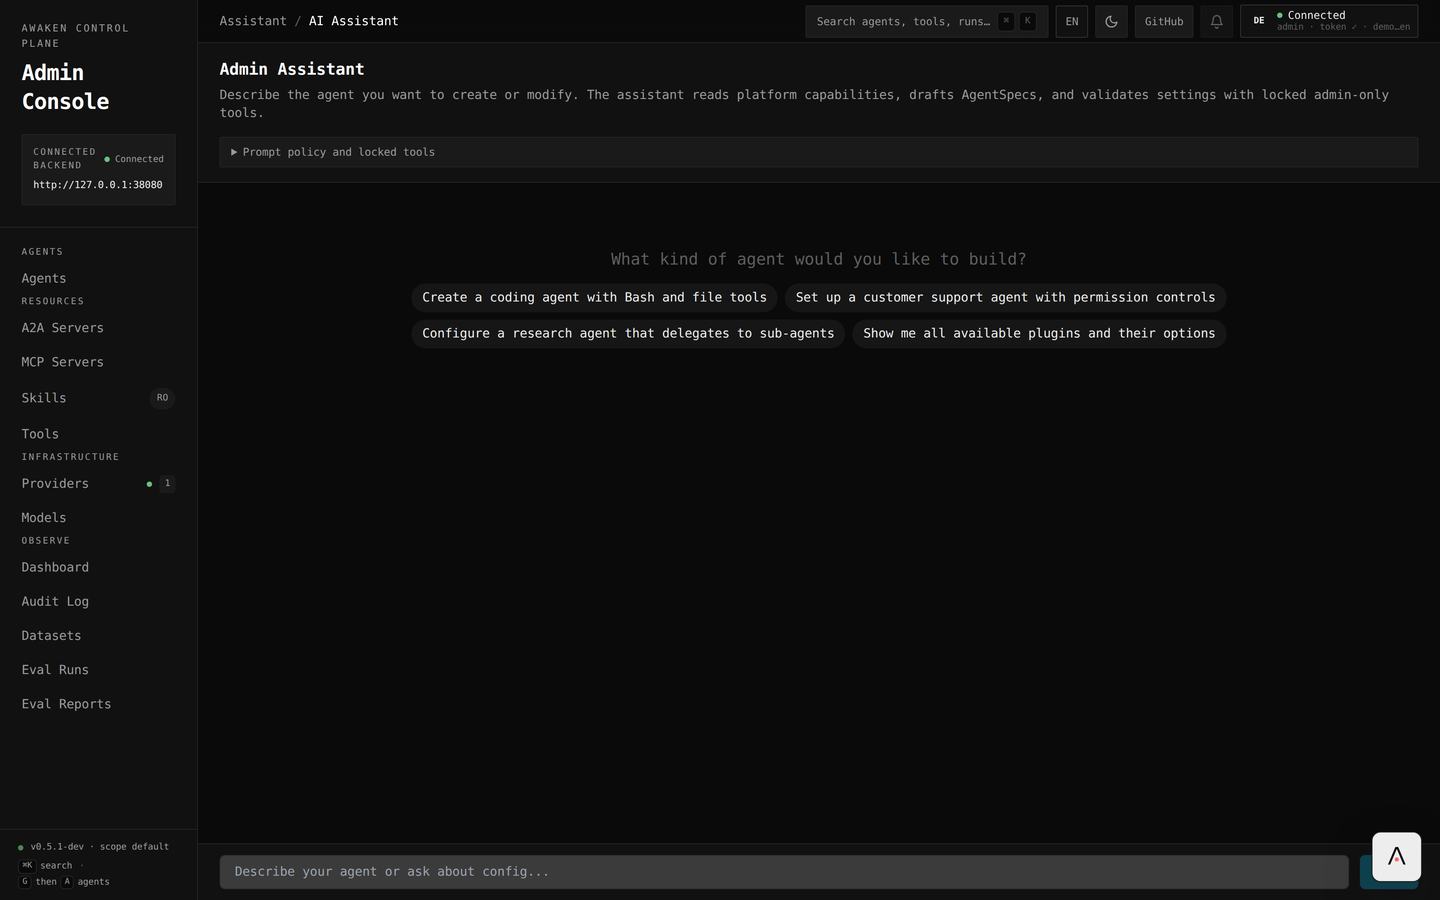
Screens and endpoints
Section titled “Screens and endpoints”Each screen is a thin client over admin REST routes (all behind the admin bearer token). For request/response shapes see the HTTP API.
| Screen | Reads / writes |
|---|---|
| Dashboard | GET /v1/capabilities, /v1/system/info, /v1/audit-log, /v1/runs/summary, runtime stats |
| Agents (list + editor) | GET/POST/PUT /v1/config/agents, validate POST /v1/config/agents/validate, draft preview POST /v1/ai-sdk/agent-previews/runs, restore POST /v1/config/agents/:id/restore, stats GET /v1/agents/:id/runtime-stats |
| Providers | GET/POST/PUT/DELETE /v1/config/providers, test POST /v1/providers/:id/test |
| Models | GET/POST/PUT/DELETE /v1/config/models |
| MCP Servers | …/config/mcp-servers, restart POST /v1/mcp-servers/:id/restart, inventory GET /v1/mcp-servers/:id/inventory |
| A2A Servers | …/config/a2a-servers, status GET /v1/a2a-servers/:id/status |
| Skills / Tools | GET /v1/config/skills (read-only), tool catalog from /v1/capabilities |
| Admin Assistant | run POST /v1/admin/assistant/runs, policy GET/PUT /v1/admin/assistant/config |
| Audit Log | GET /v1/audit-log |
| Datasets / Eval Runs | …/eval/datasets (+ /:id/items), …/eval/runs (+ /:id) |
| Eval Reports | offline NDJSON upload (no backend call) |
The provider→model→agent setup workflow, the editor tabs, and wiring a saved agent to a frontend are covered in the how-tos: Use the Admin Console, Configure Agent Behavior, and AI SDK frontend integration.
Provider credentials and MCP credentials are intentionally separate. Providers
feed model execution; MCP server credentials belong to that MCP transport
(env for stdio, URL/config for HTTP), and agent access is controlled through
tool selection plus optional permission rules. The Admin Assistant unlocks only
after the first provider-backed model is configured; its tools are server-locked
and do not appear in the normal tool registry.
Operate, Trace, And Evaluate
Section titled “Operate, Trace, And Evaluate”- Dashboard shows live workload, provider/MCP health, recent audit events,
optional runtime stats, and read-only
scope_id. - Recent runs on a saved agent opens persisted traces when trace routes are enabled.
- Datasets capture trace fixtures for evaluation.
- Eval Runs execute datasets against configured agents and models.
- Eval Reports view NDJSON reports and baseline diffs in the browser.
Trace and eval payloads may contain prompts, tool arguments, and model replies. Protect the admin bearer token and route access accordingly.
Version History And Pinning
Section titled “Version History And Pinning”Every config save records metadata and, when audit logging is wired, appears in the Audit Log. Agent History lets you inspect diffs and restore a previous snapshot back into the editing store.
Restore is intentionally a review step: after restoring, save/publish the
resource again when that restored payload should become active for new runs.
When the server is wired with a versioned registry store, published runtime
registry snapshots are immutable and durable runs carry a resolution_id so
resume and replay can reselect the same graph.
REST-only Features (No Console UI Yet)
Section titled “REST-only Features (No Console UI Yet)”The console focuses on configuration. Some surfaces are intentionally
REST-only today — drive them from curl or your own scripts with the same admin
bearer token (see the HTTP API for request shapes):
| Surface | What | Endpoints |
|---|---|---|
| Threads & runs | list / create / cancel / inspect messages | /v1/threads, /v1/runs |
| HITL decisions | resume / cancel a suspended tool call | POST /v1/runs/:id/decision |
| Mailbox | peek / push inter-agent dispatches | mailbox routes |
| Skill CRUD | the console lists skills but does not edit them | /v1/config/skills |
| Config diagnostics | registry-wide validation report (no screen renders it yet) | GET /v1/config/diagnostics |
scope_id is shown as read-only system metadata. The browser does not choose
scope directly; the server resolves scope from the trusted HttpScopeProvider
for each request. Hosted products should switch tenant/workspace scope in their
auth/provider layer and display the resolved value in the console.
Related
Section titled “Related”- Use the Admin Console - operator walkthrough
- Configure Agent Behavior - full tuning surface
- HTTP API - request and response reference