
Use the Admin Console
The Admin Console is the primary tuning and operations UI for an Awaken server. Use it after runtime capabilities exist in code: configure providers and models, create agents, tune prompts and tool descriptions, assign tools/skills/delegates, preview drafts, inspect traces, capture datasets, run evals, and review audit history from the browser.
This guide focuses on what to click. For endpoint shapes and screen-to-route mapping, see HTTP API, Config, and the Admin Console surface inventory.
Prerequisites
Section titled “Prerequisites”- A running
awaken-server. The default starter URL ishttp://127.0.0.1:38080. - An admin bearer token configured on the server.
- The Admin Console dev server running locally, or a production build served by your deployment.
# Terminal 1 — runtimeAWAKEN_HTTP_ADDR=127.0.0.1:38080 \AWAKEN_ADMIN_API_BEARER_TOKEN=dev-token \cargo run -p ai-sdk-starter-agent
# Terminal 2 — admin consolepnpm --filter awaken-admin-console dev# → http://127.0.0.1:3002
Open the console, click the top-right token pill, paste dev-token, and save.
The pill changes from Token missing to Connected.
Visual tour
Section titled “Visual tour”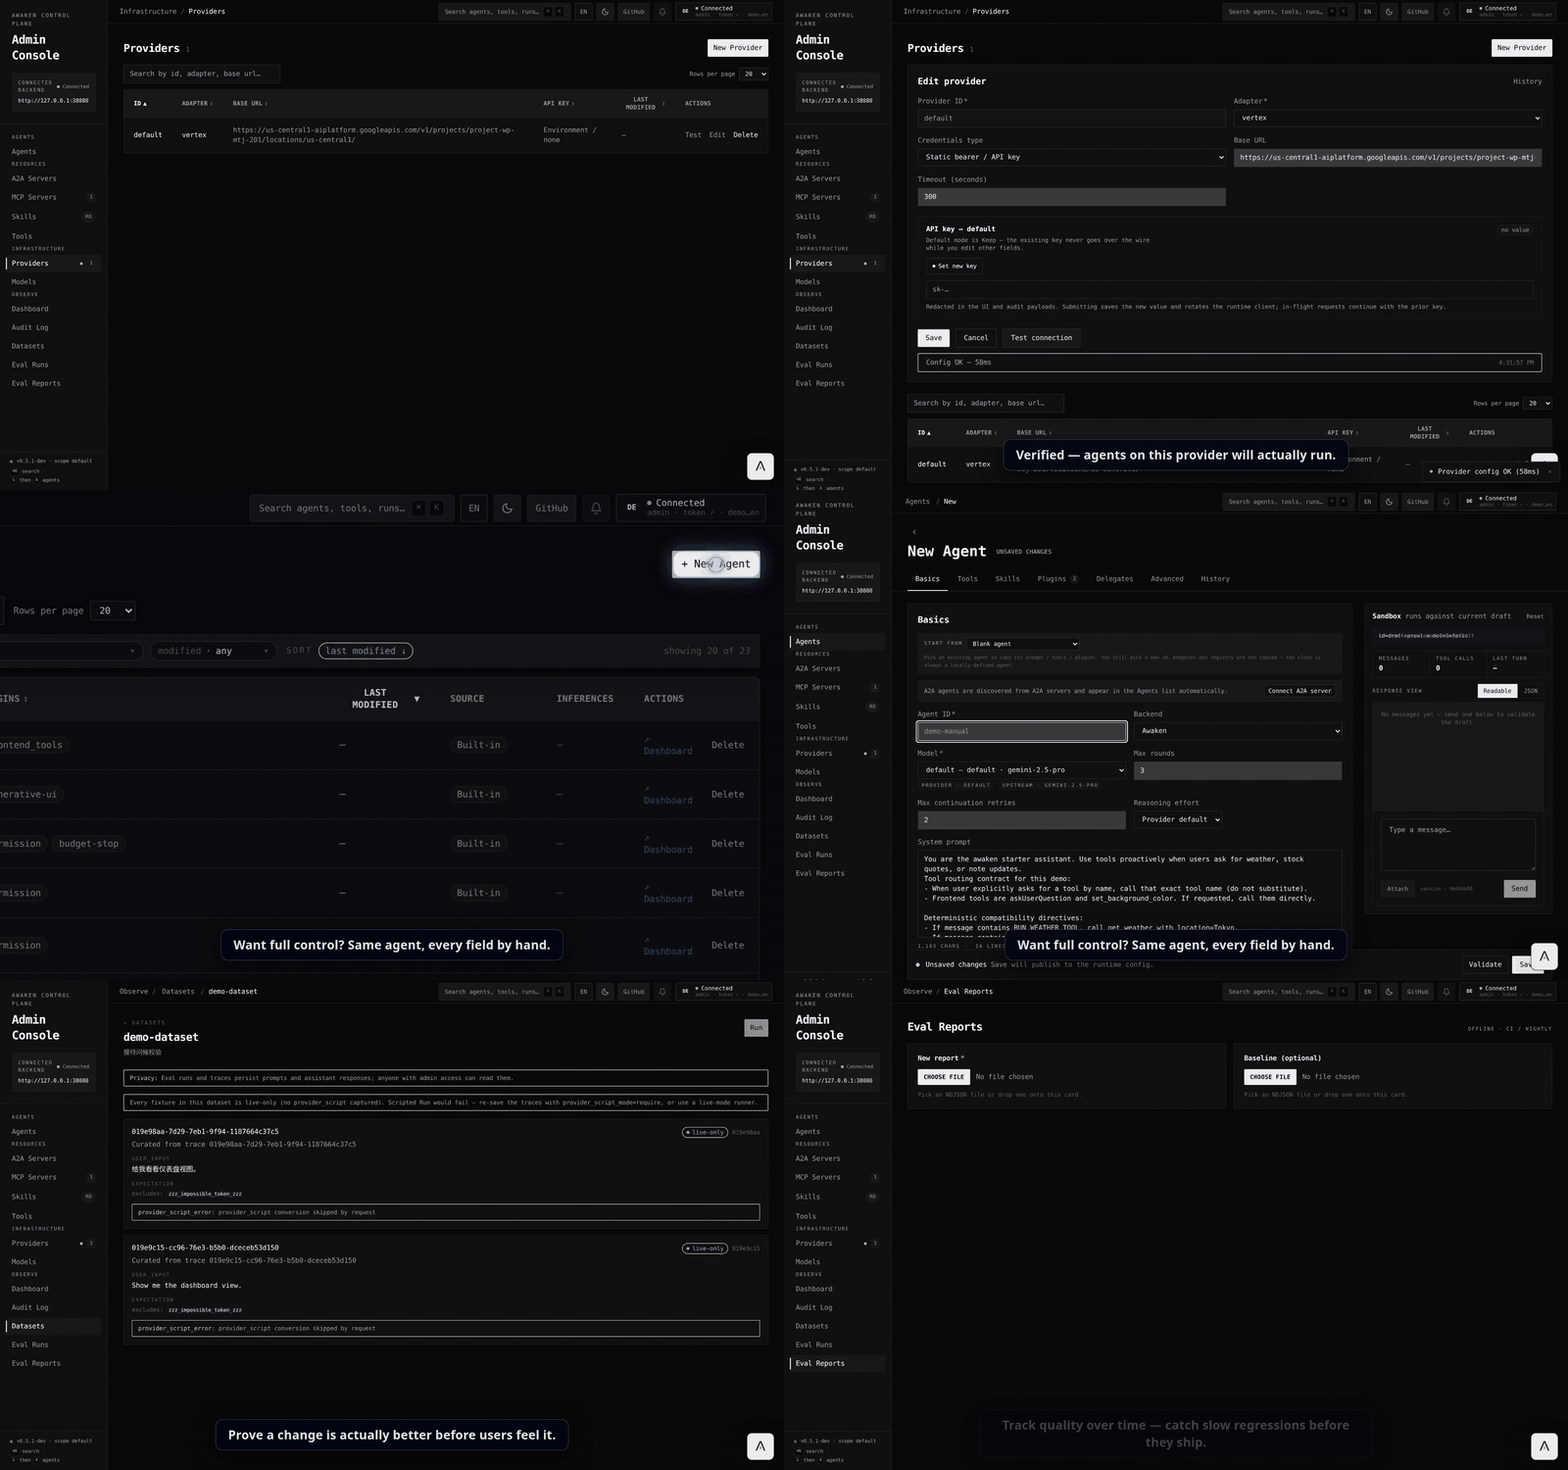
Navigate the workspace
Section titled “Navigate the workspace”The left sidebar groups screens by operator intent:
| Group | What lives here |
|---|---|
| Agents | Agent list, agent editor, per-agent dashboard. |
| Infrastructure | Providers and Models. Configure upstream access before live runs. |
| Resources | MCP Servers, A2A Servers, Skills, Tools. |
| Observe | Dashboard, Audit Log, Datasets, Eval Runs, Eval Reports. |
Use the breadcrumb in the topbar to move back to the parent screen. The Admin Assistant is a floating bubble, not a sidebar destination; it becomes useful after a provider-backed model is configured.
Connect and inspect the system
Section titled “Connect and inspect the system”- Open the console and enter the bearer token.
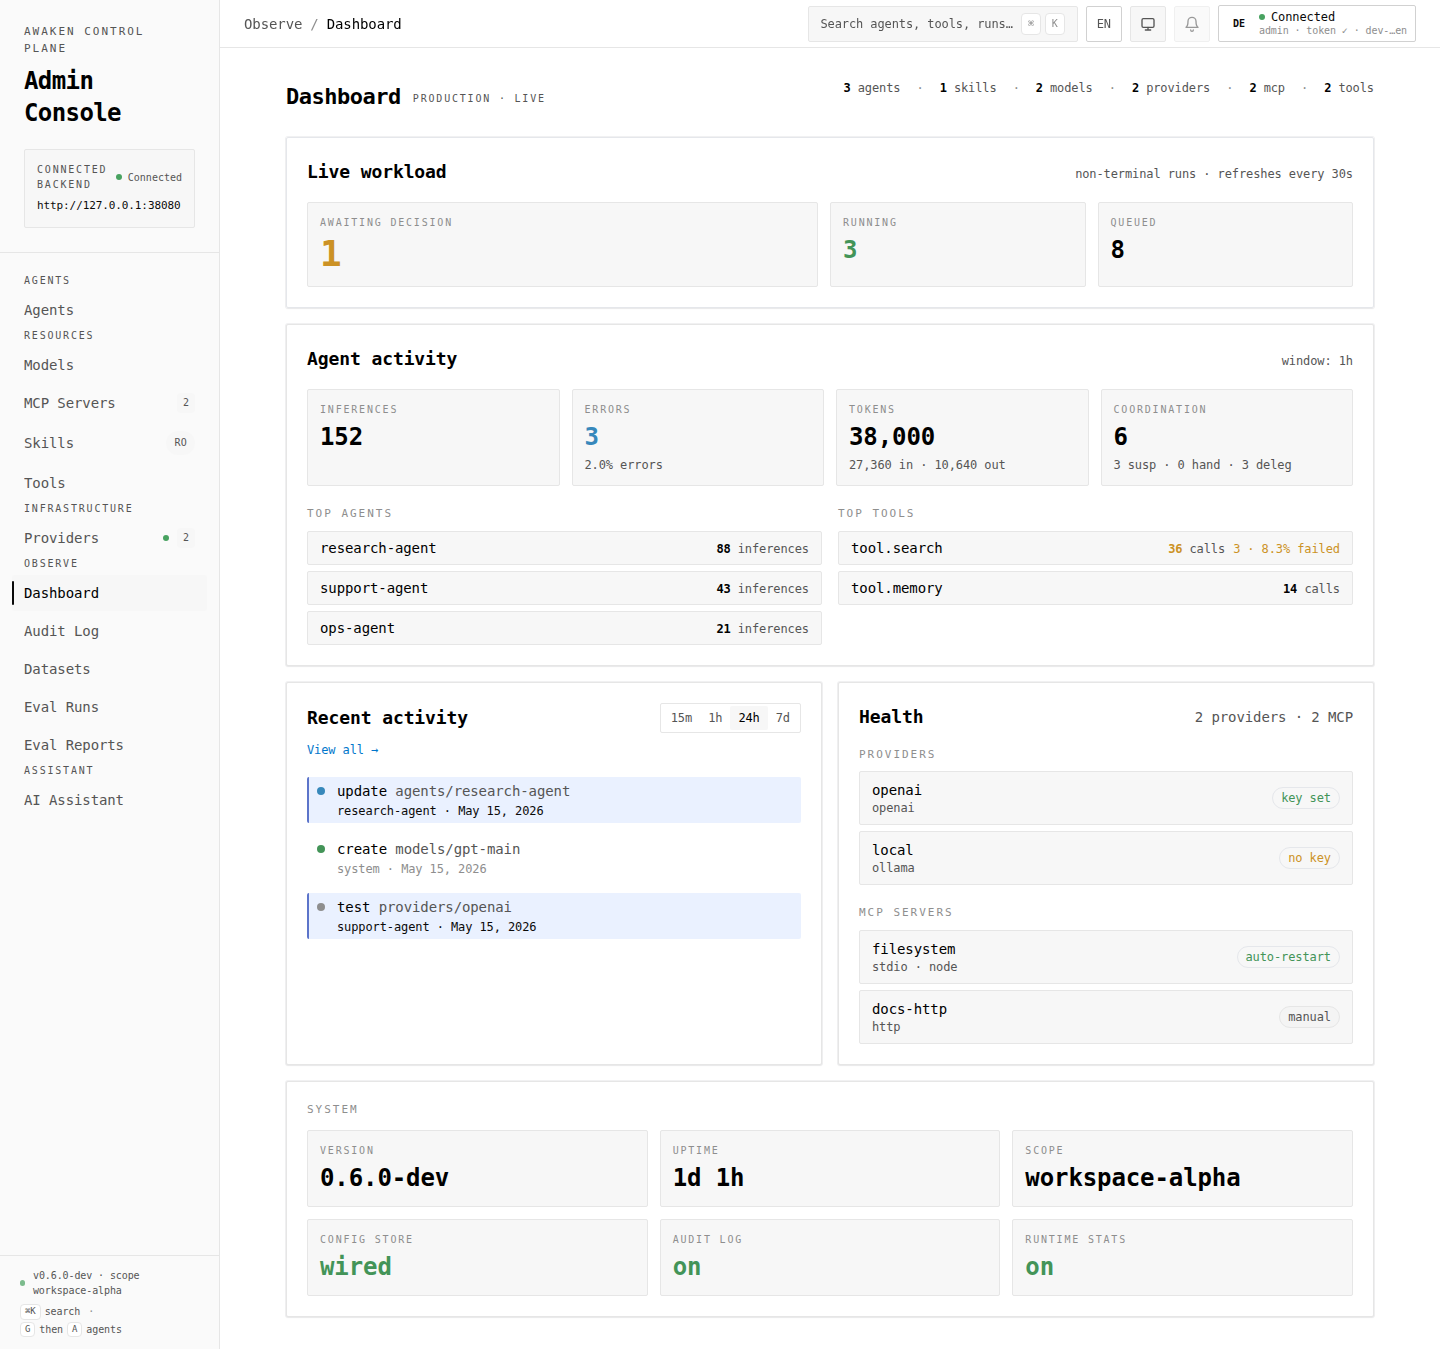
- Start on Dashboard.
- Check Health for providers without keys and MCP servers that are failing.
- Check System for version, scope, uptime, and which optional subsystems are connected.
- Use stat cards to jump to Agents, Models, Providers, Skills, MCP Servers, or Tools.
If Recent activity says the audit log is disabled, the server can still run, but History tabs and restore workflows will be empty until audit logging is wired.
Create provider and model
Section titled “Create provider and model”- Open Infrastructure → Providers.
- Create a provider with the adapter, base URL, and credentials for your model upstream.
- Use the provider row’s Test action. A toast reports success, latency, or the upstream error.
- Open Infrastructure → Models.
- Create a model id that points at the provider. Agents reference this stable model id, not raw provider credentials.
Related API: provider/model config and HTTP API.
Edit an agent
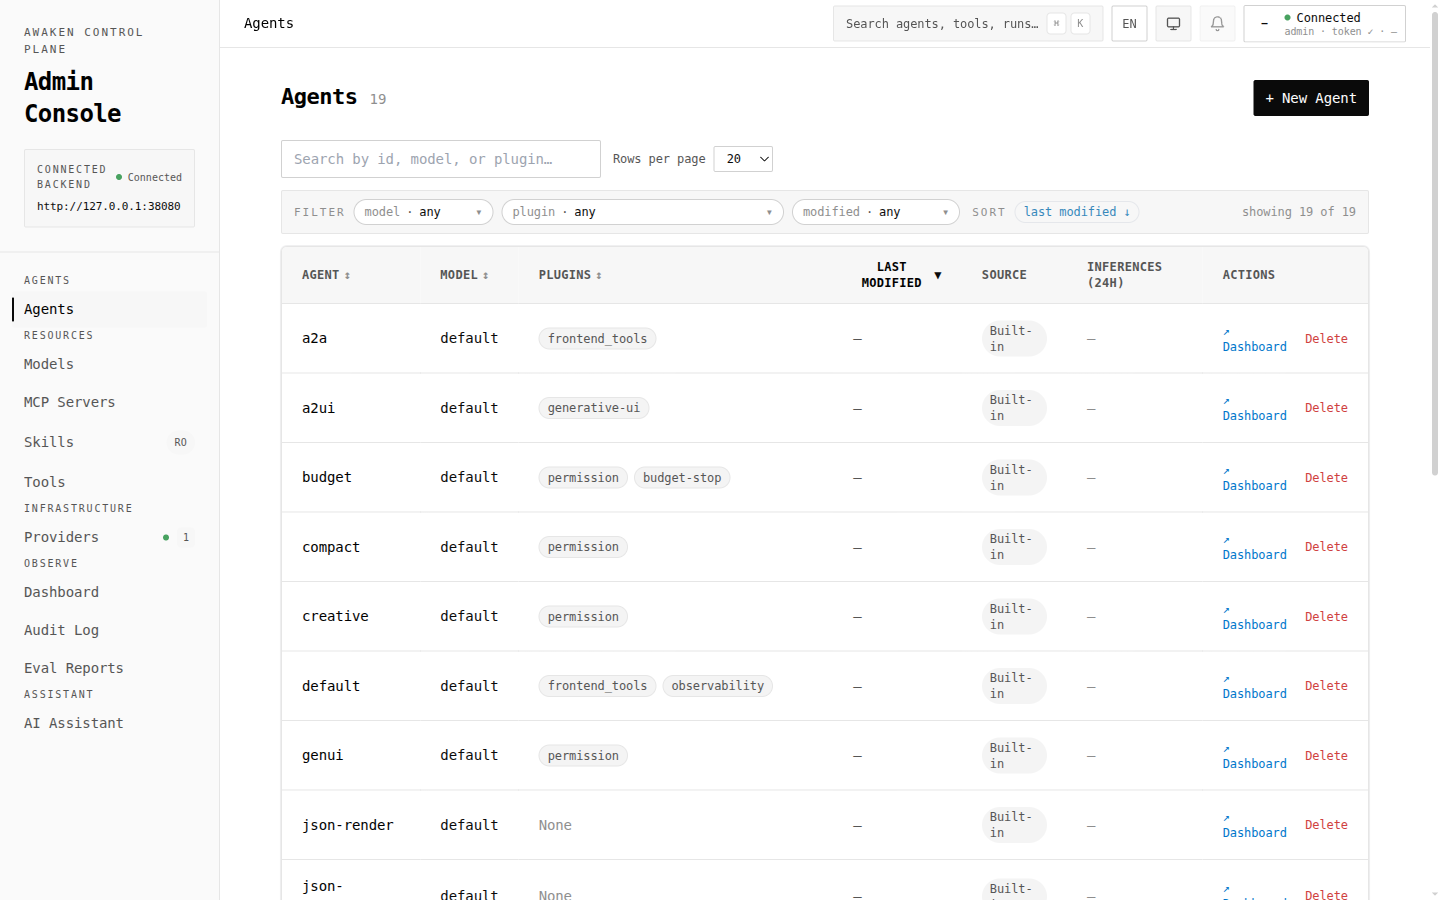
Section titled “Edit an agent”To create one, click Agents → + New Agent. To edit one, click a row in the Agents list.
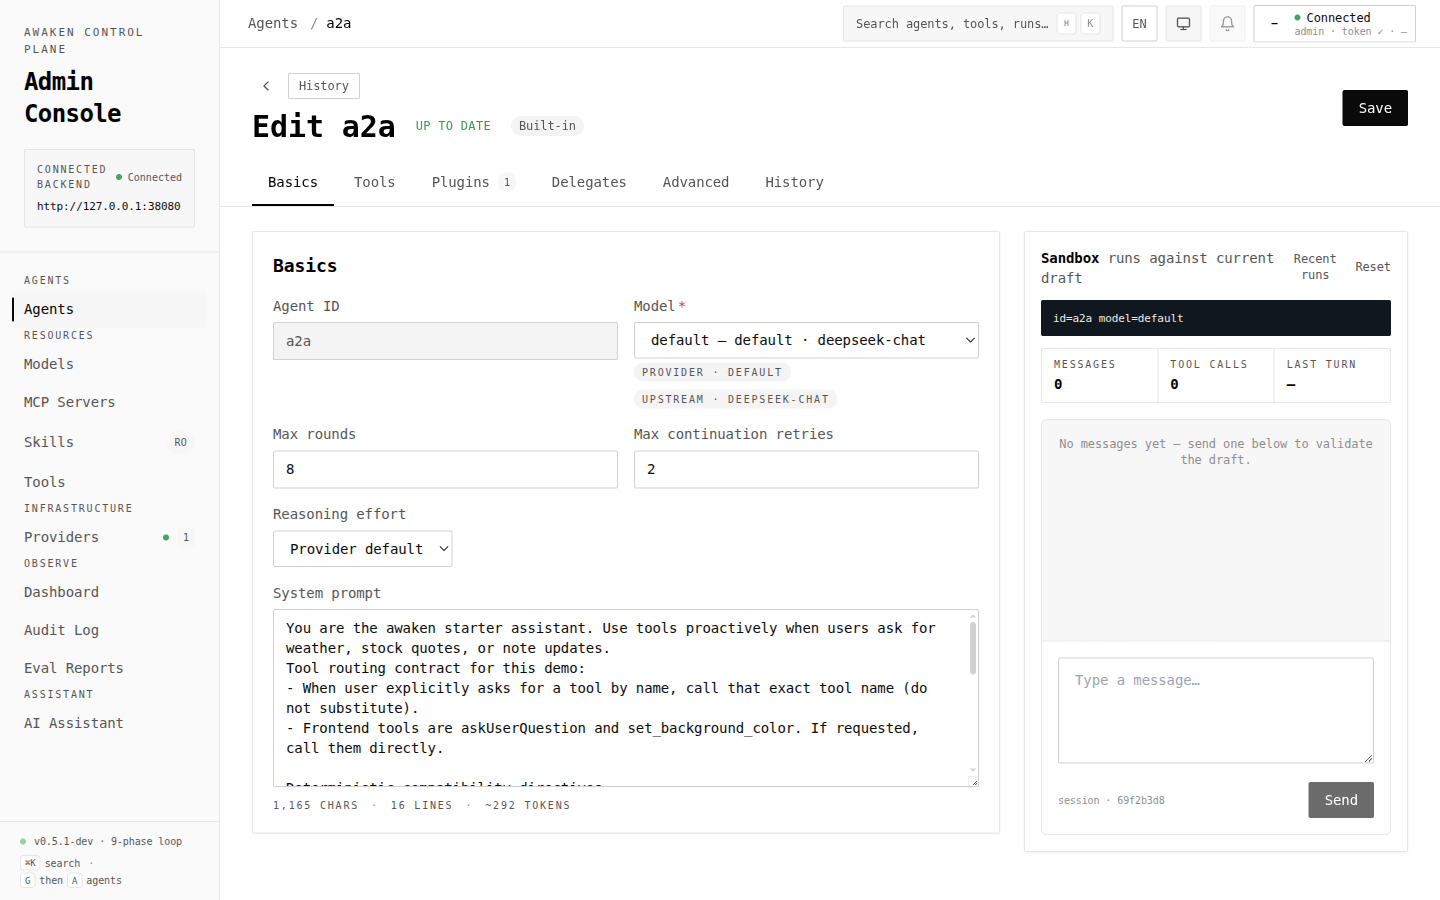
- Basics — set model, max rounds, reasoning effort, and system prompt.
- Tools — choose all tools or a custom allow/exclude selection. Use source filters to narrow built-in, plugin, and MCP tools.
- Plugins — enable or disable plugin-backed behavior.
- Delegates — select which other agents this agent can hand off to.
- Advanced — inspect the raw JSON if you need to review the final shape.
- History — inspect past changes and restore an earlier version when audit logging is enabled.
When you edit anything, the bottom save bar appears:
- Validate checks the draft without saving or applying it.
- Save / Save & Publish persists the draft and makes it available to new runs.
Use the right-side preview chat before saving. It runs against the unsaved draft so you can tune prompts, tools, and model selection without publishing first.
Related API: agents config routes in HTTP API
and AgentSpec in Config.
Tune behavior safely
Section titled “Tune behavior safely”A safe tuning pass is:
- Change one behavior dimension at a time: prompt, model, tools, plugin config, permissions, delegates, or stop policy.
- Click Validate.
- Use the preview chat with the same scenario you care about.
- Save only after the preview behaves as expected.
- Run a real task or eval fixture to confirm behavior outside the draft preview.
- If the result regresses, open History and restore the previous version.
See Configure Agent Behavior for the full tab-by-tab tuning map.
Manage resources
Section titled “Manage resources”Restart an MCP server
Section titled “Restart an MCP server”- Open Resources → MCP Servers.
- Click a server and scroll to Live Status.
- Check connection state, handshake result, tool count, and retry/failure summary.
- Click Restart. The button is disabled while restart is in flight.
Connect an A2A server
Section titled “Connect an A2A server”Open Resources → A2A Servers, click New A2A server, and enter the remote server base URL. Awaken discovers the remote agent cards and makes them available for delegation. See Connect an A2A Server.
Review skills and tools
Section titled “Review skills and tools”Use Skills and Tools to inspect what the running server has discovered. Agent access is still controlled from the agent editor’s Tools, Plugins, and Delegates tabs.
Observe runs and compare behavior
Section titled “Observe runs and compare behavior”Use Observe screens after real traffic or preview runs exist:
- Dashboard — workload, health, and recent activity.
- Audit Log — global create/update/delete/restart/restore history.
- Datasets — captured fixtures you can replay.
- Eval Runs — execution records for eval jobs.
- Eval Reports — pass/fail and baseline diffs.
For the full evaluation workflow, see Capture a Dataset and Run an Eval.
Restore a previous version
Section titled “Restore a previous version”Awaken’s audit log doubles as version history.
- Open an agent, model, provider, or MCP server editor.
- Switch to History.
- Expand an event to review the before/after diff.
- Click Restore this version.
- Review the diff and confirm.
- Validate and save the restored draft when you are ready for new runs to use it.
Related API: restore routes in HTTP API and audit behavior in Admin Console surface inventory.
Enable optional subsystems
Section titled “Enable optional subsystems”The console degrades honestly when optional server modules are absent:
| If absent | What you see | Enable via |
|---|---|---|
| Audit log | Dashboard disabled notice, empty Audit Log, empty History tabs | Config reference and server wiring |
| Runtime stats | Agents list shows n/a; per-agent latency charts are unavailable | Enable Observability |
| Trace/eval stores | Dataset/eval screens cannot persist useful records | Capture a Dataset and Run an Eval |
What still belongs in API automation
Section titled “What still belongs in API automation”The console focuses on configuration and operator review. Use the HTTP API or your own tooling for live execution and lower-level control:
- Threads, messages, and run inspection.
- Programmatic run creation, cancel, interrupt, and resume.
- HITL decisions for custom UIs.
- Mailbox inspection and dispatch automation.
- Registry diagnostics and bulk config management.
See the REST-only features matrix and HTTP API reference.
Troubleshooting
Section titled “Troubleshooting”| Symptom | Likely cause | Fix |
|---|---|---|
| Topbar says Token missing or Token rejected | Bearer token absent or wrong | Click the pill and paste the token configured on the server. |
| Topbar says Backend unreachable | Server not listening or wrong URL | Confirm the server is running on BACKEND_URL; default is http://127.0.0.1:38080. |
| Pages load but show optional subsystem warnings | Audit/runtime stats/trace/eval stores are not wired | Enable the corresponding subsystem on the server. |
| Save fails with “config management API not enabled” | No config store is wired | Start a server with config management enabled. |
| Provider Test reports unsupported adapter | The provider is scripted or not testable | Expected for scripted/demo providers; test a real adapter before production. |