
Enable Observability
Observability has two parts: server wiring and operator review. This guide focuses on what the operator should see and click after the server exposes runtime stats, traces, audit, and eval stores.
What you click first
Section titled “What you click first”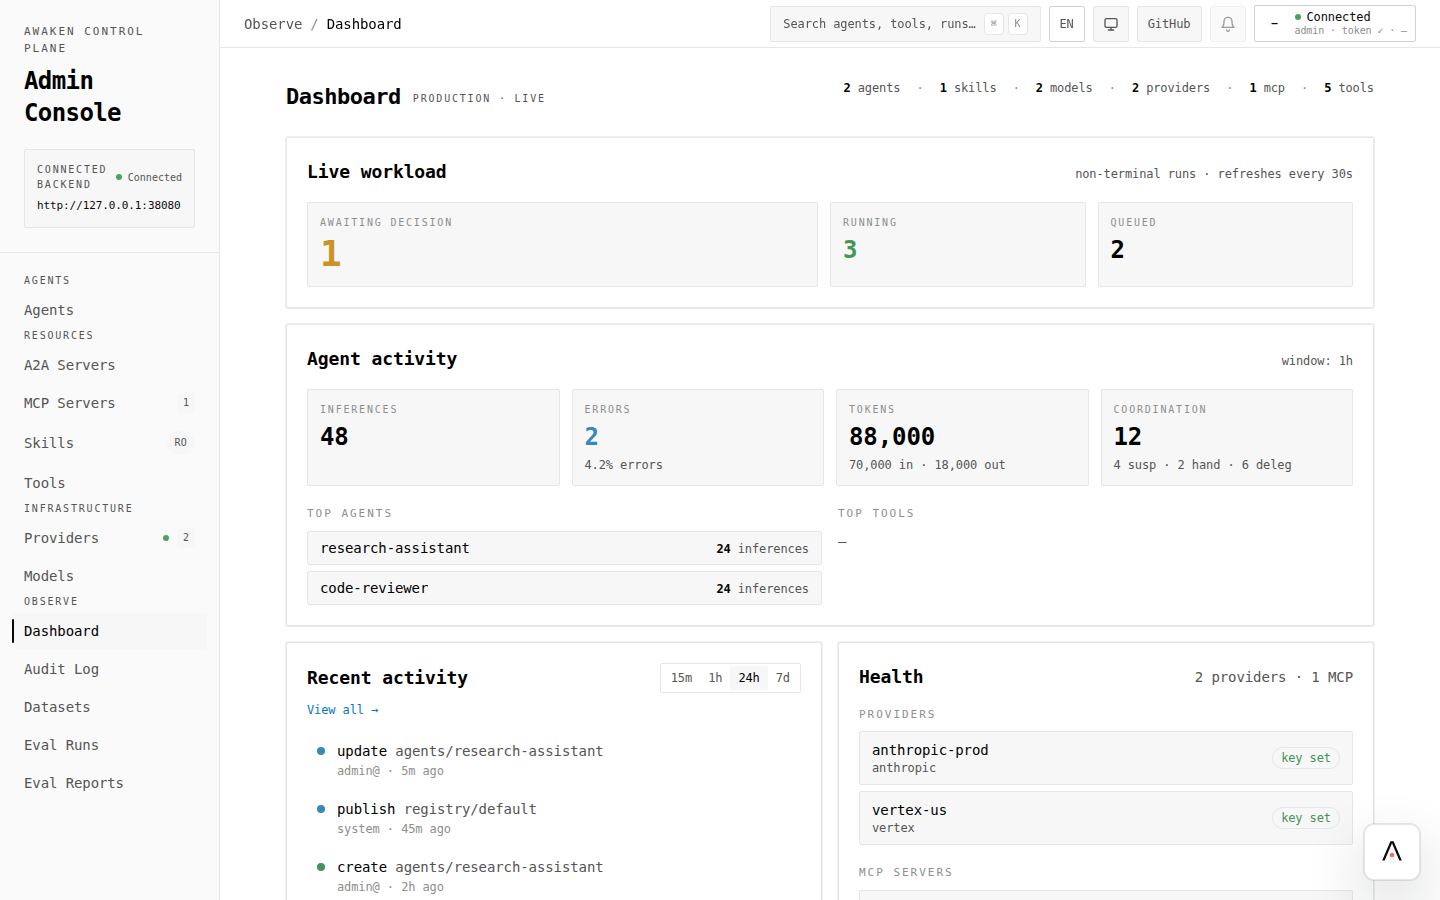
- Open Dashboard.
- Check Health and System for audit log, runtime stats, trace, and eval availability.
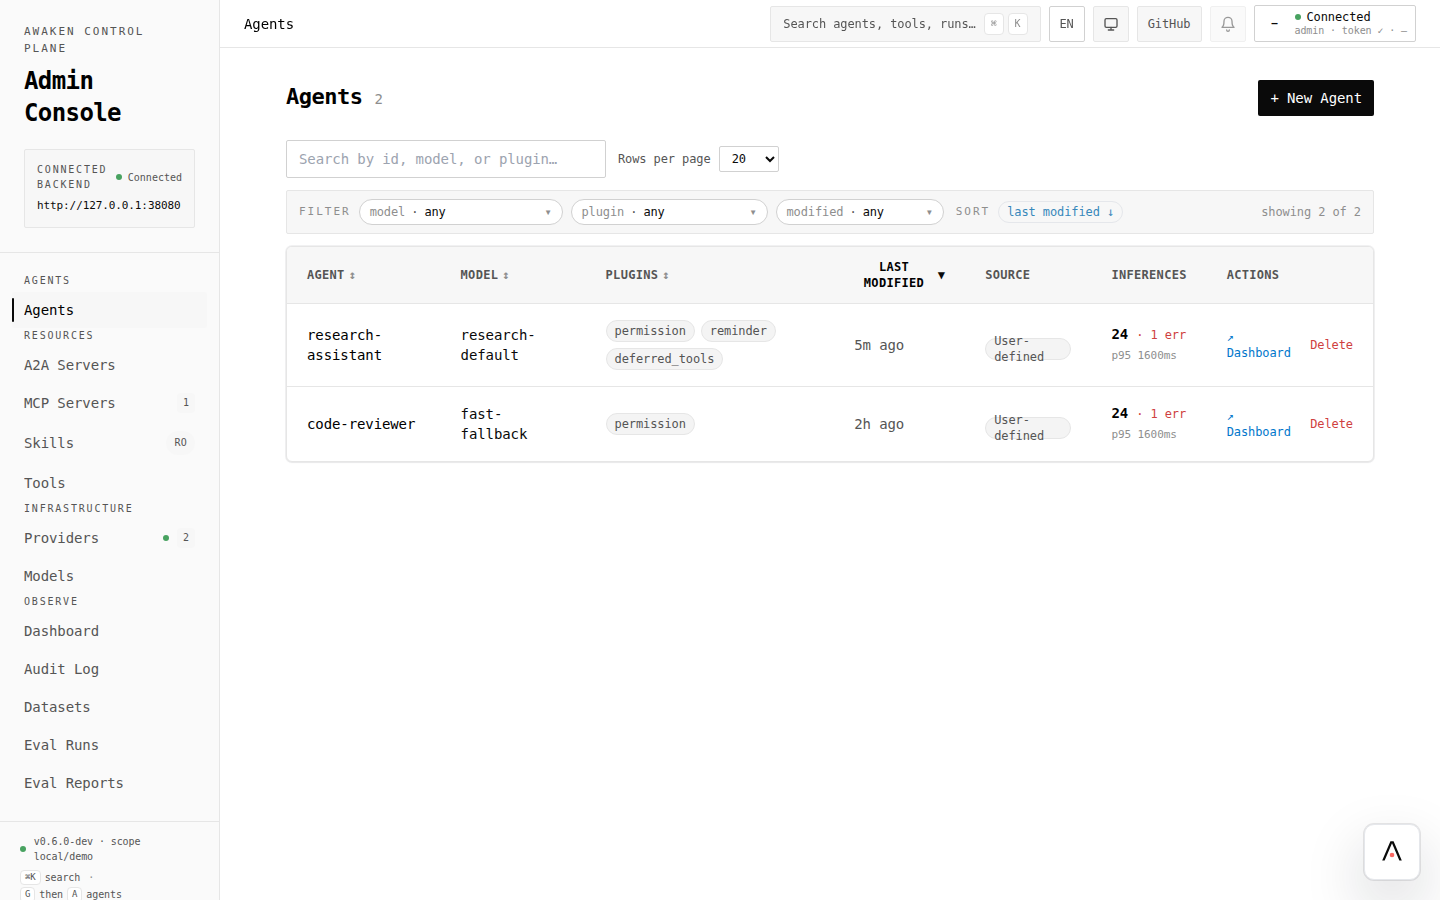
- Open Agents and look for inference counts, latency, and error signals.
- Open a saved agent and use Recent runs when trace routes are enabled.
- Save important traces as dataset fixtures.
- Run an eval and inspect the report before accepting a behavior change.
What each surface tells you
Section titled “What each surface tells you”| Surface | Use it for |
|---|---|
| Dashboard | Health, workload, recent audit activity, and subsystem availability. |
| Agents list | Per-agent runtime signals such as inference count, errors, and latency when stats are wired. |
| Recent runs / traces | Tool calls, model output, prompt variants, and final status for a run. |
| Datasets | Curated traces that become repeatable fixtures. |
| Eval Runs | Live or scripted replay results. |
| Eval Reports | Offline NDJSON report review and baseline comparison. |
Evaluate what you observed
Section titled “Evaluate what you observed”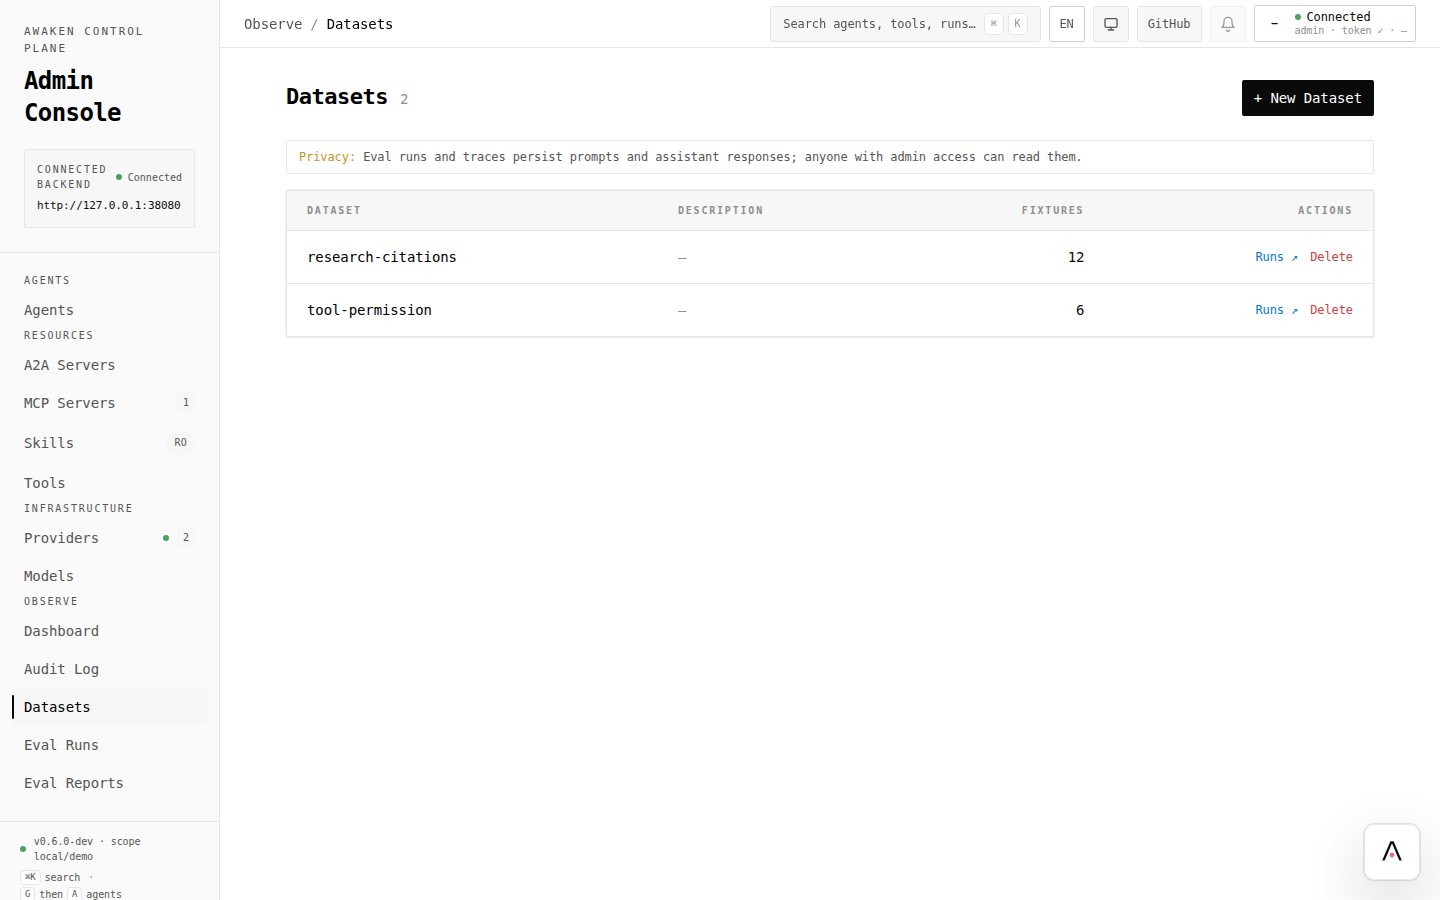
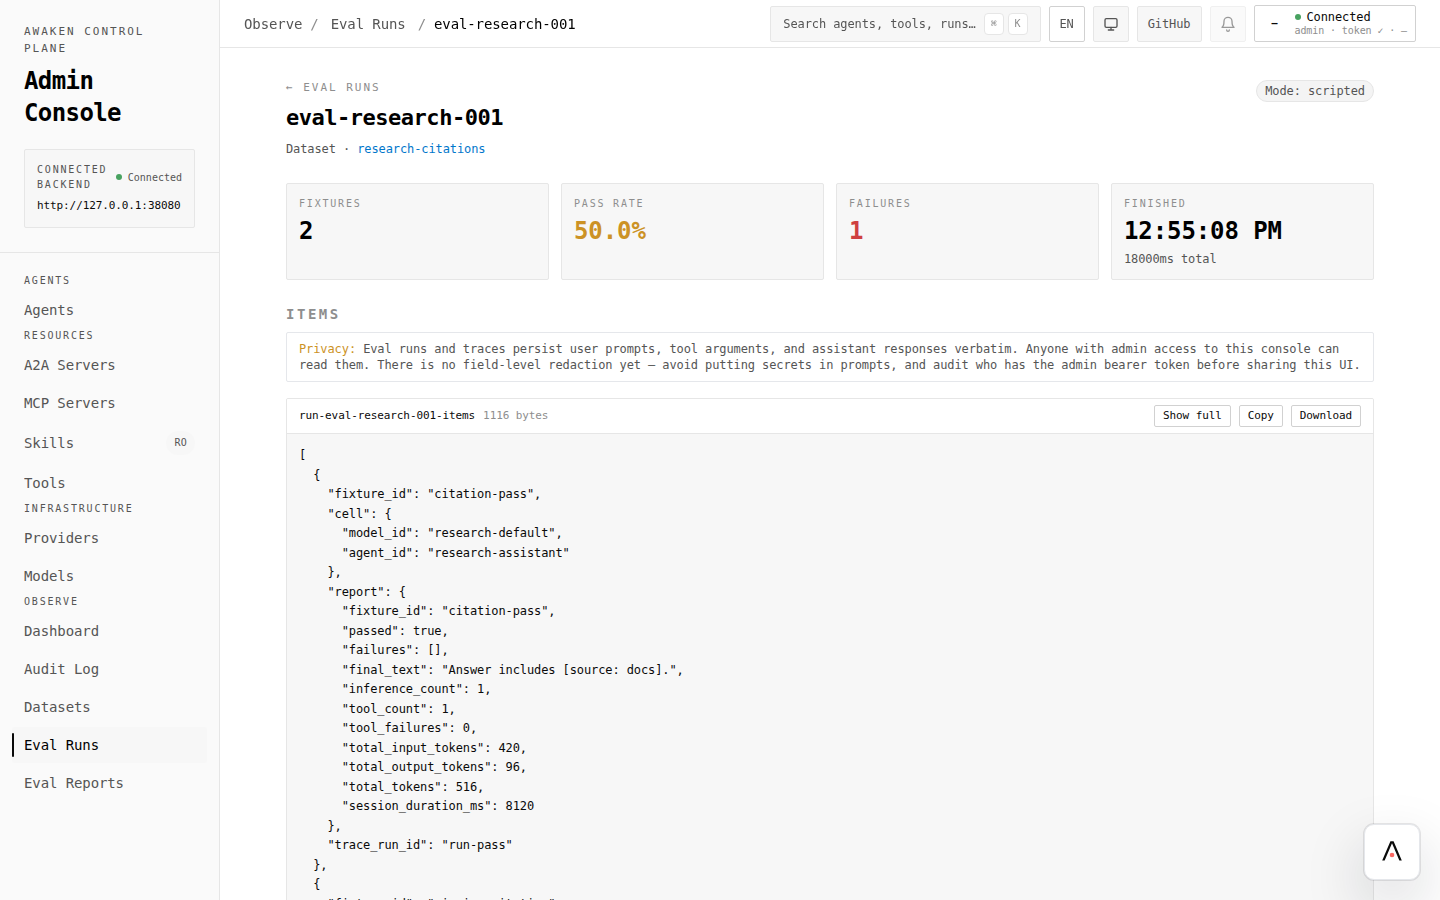
Use evals whenever a dashboard or trace observation leads to a tuning change. The loop is: observe → tune one field → validate → preview → save → rerun the same fixture.
Server wiring checklist
Section titled “Server wiring checklist”If a screen says a subsystem is unavailable, the UI is working: the server has not exposed that store or route yet.
| Missing in UI | Server side to check |
|---|---|
| Empty History or Audit Log disabled | Audit log store/wiring |
Agent stats show n/a | Runtime stats registry/store |
| No recent runs or trace drawer | Trace capture/store routes |
| Dataset/eval pages disabled | Eval dataset and run stores |
| No external telemetry spans | OTel exporter and collector configuration |
Developer wiring references
Section titled “Developer wiring references”When building a custom observability backend, keep the UI flow above tied to the code surfaces that feed it:
MetricsSinkreceives runtime metrics; useCompositeSinkorBatchingSinkwhen one run should feed several destinations.TraceStorebacks recent runs, trace drawers, and dataset fixture curation.RuntimeStatsRegistryfeeds per-agent counts, latency, and error signals.SamplingPolicycontrols which spans are retained before they reach durable storage.
Code references: crates/awaken-ext-observability/src/sink.rs,
crates/awaken-ext-observability/src/trace_store/,
crates/awaken-ext-observability/tests/observability_integration.rs, and
crates/awaken-ext-observability/tests/wiring_integration.rs.